
Vistra (VST) · Utilities
Vistra Q3 2026 earnings: summary, key numbers & outlook
Results filed 6 Nov 2026 · Quarter ended 30 Sep 2026
Slides (46 pages)Press release ↗Investor relations ↗
Summaries and transcripts are machine-generated and can contain errors.
In brief
Vistra reported third quarter 2026 Net Income of $1,140 million and Ongoing Operations Adjusted EBITDA of $2,378 million, with more than 50% growth in Ongoing Operations Adjusted EBITDA compared to third quarter 2025.
Vistra had a very strong summer quarter. GAAP net income was $1,140 million, up from $652 million a year earlier. That included a $559 million unrealized hedge gain. Ongoing Operations Adjusted EBITDA, the company's core profit measure, rose to $2,378 million from $1,581 million. Record heat, higher energy and capacity prices, the Lotus plants and the restart of Martin Lake Unit 1 all helped. Texas and East led the gains, and Retail also improved.
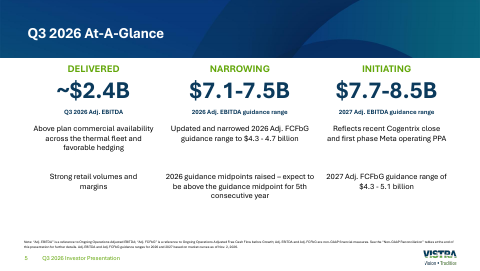
Management raised the midpoint and narrowed the 2026 Ongoing Operations Adjusted EBITDA range to $7.1 billion to $7.5 billion. It also set 2027 guidance of $7.7 billion to $8.5 billion. The Cogentrix acquisition closed in October. It added about 5,500 MW of gas capacity, but it also used cash. Pro forma liquidity falls to about $5.4 billion from $8,923 million. Weather, power prices and integrating Cogentrix are the main risks.
Slides & documents
Open the slide deck (PDF, 46 pages) ↗
Showing the first 6 of 46 pages.
SEC filing
Key numbers
- Operating revenues (Q3) · GAAP
- $6.3B
- Net income (Q3) · GAAP
- $1,140 million
- Operating income (Q3) · GAAP
- $1.7B
- Ongoing Operations Adjusted EBITDA (Q3) · non-GAAP
- $2,378 million
- Cash provided by operating activities (nine months) · GAAP
- $4.3B
up from $4,971 in the third quarter of 2025
up from $652 million in the third quarter of 2025
up from 1,037 in the third quarter of 2025
more than 50% growth compared to third quarter 2025
up from 2,638 in the first nine months of 2025
| Segment or metric | Value | Change |
|---|---|---|
| Texas Adjusted EBITDA (Q3) | $1.2B | up from $784 in the third quarter of 2025 |
| East Adjusted EBITDA (Q3) | $979.0M | up from $719 in the third quarter of 2025 |
| Retail Adjusted EBITDA (Q3) | $98.0M | up from $37 in the third quarter of 2025 |
| West Adjusted EBITDA (Q3) | $76.0M | up from $63 in the third quarter of 2025 |
Where each number comes from
- Operating revenues (Q3): “Three Months Ended September 30, | Nine Months Ended September 30, 2026 | 2025 | 2026 | 2025 Operating revenues | $6,347 | $4,971 | $16,004 | $13,154”
- Net income (Q3): “For the quarter ended September 30, 2026, Vistra reported Net Income of $1,140 million and Ongoing Operations Adjusted EBITDA1 of $2,378 million.”
- Operating income (Q3): “Impairment of long-lived assets | (269) | (5) | (269) | (73) Operating income | 1,706 | 1,037 | 3,758 | 1,432”
- Ongoing Operations Adjusted EBITDA (Q3): “Achieved more than 50% growth in Ongoing Operations Adjusted EBITDA1 to $2,378 million for the quarter compared to third quarter 2025.”
- Cash provided by operating activities (nine months): “Other operating assets and liabilities | (730) | (562) Cash provided by operating activities | 4,330 | 2,638 Cash flows — investing activities:”
- Texas Adjusted EBITDA (Q3): “Retail | $98 | $37 | $939 | $977 Texas | $1,227 | $784 | $2,124 | $1,416 East | $979 | $719 | $2,422 | $1,651 West | $76 | $63 | $200 | $174”
- East Adjusted EBITDA (Q3): “Retail | $98 | $37 | $939 | $977 Texas | $1,227 | $784 | $2,124 | $1,416 East | $979 | $719 | $2,422 | $1,651 West | $76 | $63 | $200 | $174”
- Retail Adjusted EBITDA (Q3): “Retail | $98 | $37 | $939 | $977 Texas | $1,227 | $784 | $2,124 | $1,416 East | $979 | $719 | $2,422 | $1,651 West | $76 | $63 | $200 | $174”
- West Adjusted EBITDA (Q3): “Retail | $98 | $37 | $939 | $977 Texas | $1,227 | $784 | $2,124 | $1,416 East | $979 | $719 | $2,422 | $1,651 West | $76 | $63 | $200 | $174”
Copied from the press release ↗ and other documents in the SEC filing ↗. A figure is published only if its sentence is in the filing.
| From the filing | Q3 2026 | vs year ago | vs last quarter |
|---|---|---|---|
| Revenue | $6.3B | +27.7% | +58.0% |
| Operating income | $1.7B | +64.5% | +208.5% |
| Net income | $1.1B | +74.8% | +273.8% |
| Diluted EPS | $3.23 | +84.6% | +325.0% |
| Free cash flow | $1.4B | +34.9% | +307.5% |
| Operating margin | 26.9% | +6.0 pts | +13.1 pts |
Calculated by code from XBRL, not by the model.
Outlook
| Metric | Period | Outlook |
|---|---|---|
| Ongoing Operations Adjusted EBITDA | 2026 | $7.1 billion to $7.5 billion |
| Ongoing Operations Adjusted FCFbG | 2026 | $4.3 billion to $4.7 billion |
| Ongoing Operations Adjusted EBITDA | 2027 | $7.7 billion to $8.5 billion |
| Ongoing Operations Adjusted FCFbG | 2027 | $4.3 billion to $5.1 billion |
| Capital expenditures including nuclear fuel purchases and LTSA prepayments (millions) | 2026 | (1,711) |
Key takeaways
Ongoing Operations Adjusted EBITDA grew more than 50%
Ongoing Operations Adjusted EBITDA was $2,378 million versus $1,581 million in third quarter 2025. Higher realized energy and capacity prices, the Lotus plants and Martin Lake Unit 1 drove the increase.
2026 guidance midpoint raised and range narrowed
Ongoing Operations Adjusted EBITDA guidance is now $7,100 - $7,500 million. Adjusted FCFbG guidance is $4,300 - $4,700 million.
2027 guidance points to higher EBITDA
Vistra initiated 2027 Ongoing Operations Adjusted EBITDA guidance of $7,700 - $8,500 million. Adjusted FCFbG guidance is $4,300 - $5,100 million.
Cogentrix closed, but liquidity falls
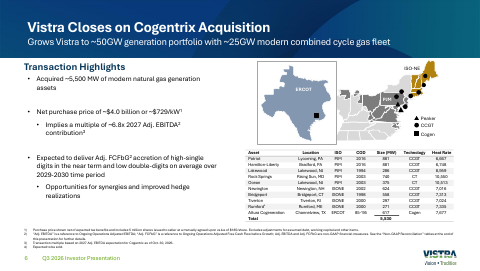
The ~5,500 MW Cogentrix acquisition closed in October 2026. Vistra also redeemed its $1 billion of Series A Preferred Stock, so available liquidity falls from approximately $8,923 million to approximately $5.4 billion on a pro forma basis.
Buyback expanded and growth contracts advancing
The Board authorized an additional $1.5 billion of share repurchases, leaving ~$2.5 billion available. Vistra began operations at Pulaski and Deer Creek and signed a 20-year 207 MW agreement with New Era Energy and Digital.
Charts
Fourth quarter worked out from the annual figure.
Data
| Q4 2024 | $4.0B * |
| Q1 2025 | $3.9B |
| Q2 2025 | $4.2B |
| Q3 2025 | $5.0B |
| Q4 2025 | $4.6B * |
| Q1 2026 | $5.6B |
| Q2 2026 | $4.0B |
| Q3 2026 | $6.3B |
Data
| Q1 2025 | -$0.93 |
| Q2 2025 | $0.81 |
| Q3 2025 | $1.75 |
| Q1 2026 | $2.87 |
| Q2 2026 | $0.76 |
| Q3 2026 | $3.23 |
Fourth-quarter EPS appears once the press release is read; filings report it only for the full year.
Data
| Q4 2024 | 14.8% |
| Q1 2025 | -3.1% |
| Q2 2025 | 12.1% |
| Q3 2025 | 20.9% |
| Q4 2025 | 10.3% |
| Q1 2026 | 26.6% |
| Q2 2026 | 13.8% |
| Q3 2026 | 26.9% |
Data
| Q4 2024 | $923.0M |
| Q1 2025 | -$169.0M |
| Q2 2025 | -$118.0M |
| Q3 2025 | $1.0B |
| Q4 2025 | $596.0M |
| Q1 2026 | $316.0M |
| Q2 2026 | $334.0M |
| Q3 2026 | $1.4B |
Operating cash flow minus capital expenditure, from cash flow statements.
Questions
What were Vistra's third quarter 2026 results?
Net income was $1,140 million, up from $652 million a year earlier. Ongoing Operations Adjusted EBITDA was $2,378 million, up from $1,581 million.
What is Vistra's guidance for 2026?
Vistra raised the midpoint and narrowed the 2026 Ongoing Operations Adjusted EBITDA range to $7.1 billion to $7.5 billion. It narrowed Ongoing Operations Adjusted FCFbG to $4.3 billion to $4.7 billion.
What did Vistra guide for 2027?
Vistra initiated 2027 Ongoing Operations Adjusted EBITDA guidance of $7.7 billion to $8.5 billion. It set Ongoing Operations Adjusted FCFbG guidance of $4.3 billion to $5.1 billion.
What is the Cogentrix acquisition?
Vistra closed the acquisition in October 2026, adding approximately 5,500 MW of natural gas-fueled generation. The investor presentation gives a net purchase price of ~$4.0 billion, or ~$729/kW.
How much of Vistra's generation is hedged and what is its liquidity?
As of Oct. 30, 2026, Vistra had hedged approximately 100% of expected 2026 generation volumes, approximately 98% for 2027 and approximately 78% for 2028. Liquidity was approximately $8,923 million at September 30, falling to approximately $5.4 billion pro forma after the Cogentrix closing, the preferred redemption and debt repayment.
Call recording
Call recording on YouTube ↗. Official replay ↗.