Summaries and transcripts are machine-generated and can contain errors.
In brief
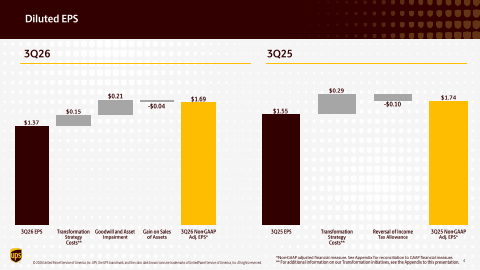
UPS reported third-quarter 2026 consolidated revenue of $22.9 billion, up 6.7%, with diluted EPS of $1.37 and non-GAAP adjusted diluted EPS of $1.69.
UPS grew revenue 6.7% to $22.9 billion, with growth in all three segments. Diluted EPS was $1.37 and adjusted EPS was $1.69, down from $1.74 a year earlier. The prior-year quarter included a $330M sale-leaseback gain. U.S. Domestic adjusted operating profit rose 14.3% to $1,034 M as revenue per piece (up 6.1%) outpaced cost per piece, while average daily volume fell 3.3% after deliberate Amazon volume cuts. International returned to profit growth. Supply Chain Solutions took a $182 million goodwill impairment.
Management raised guidance. It now expects full-year revenue of about $92.6 billion, adjusted operating profit of about $8.75 billion, adjusted EPS of about $7.28 and free cash flow of about $6.1B. Fourth-quarter revenue is guided to about $25.7 billion. The main tension is that total U.S. volume is still falling year over year and fourth-quarter profit depends on peak-season execution. Other risks are a Teamsters contract expiring in 2028 and uncertain international trade lanes.
Consolidated revenue rose 6.7% to $22.9 billion, with U.S. Domestic up 4.5%, International up 7.1% and Supply Chain Solutions up 18.2%.
U.S. profit rose despite falling volume
U.S. Domestic non-GAAP adjusted operating profit rose 14.3% to $1,034 M, and margin reached 7.0%. Revenue per piece rose 6.1% while average daily volume fell 3.3%.
Adjusted EPS slipped against a tough comparison
Non-GAAP adjusted diluted EPS was $1.69 versus $1.74, and the prior-year quarter included a $330M pre-tax gain from a sale-leaseback transaction.
Supply Chain Solutions margin fell sharply
Revenue rose 18.2%, but non-GAAP adjusted operating margin was 9.2% versus 21.3%, and GAAP results included a $182 million goodwill impairment.
Guidance raised across the board
Full-year revenue is now about $92.6 billion, adjusted EPS about $7.28 and free cash flow about $6.1B, with fourth-quarter revenue about $25.7 billion.
Charts
Revenue$22.9B+6.7% y/yQ3 2026
Fourth quarter worked out from the annual figure.
Data
Q4 2024
$25.3B *
Q1 2025
$21.5B
Q2 2025
$21.2B
Q3 2025
$21.4B
Q4 2025
$24.5B *
Q1 2026
$21.2B
Q2 2026
$22.8B
Q3 2026
$22.9B
Diluted EPS (GAAP)$1.37−11.6% y/yQ3 2026Data
Q1 2025
$1.40
Q2 2025
$1.51
Q3 2025
$1.55
Q1 2026
$1.02
Q2 2026
$0.71
Q3 2026
$1.37
Fourth-quarter EPS appears once the press release is read; filings report it only for the full year.
Operating margin7.6%−0.8 pts y/yQ3 2026Data
Q4 2024
11.6%
Q1 2025
7.7%
Q2 2025
8.6%
Q3 2025
8.4%
Q4 2025
10.5%
Q1 2026
6.0%
Q2 2026
4.1%
Q3 2026
7.6%
Free cash flow$2.4B+59.1% y/yQ3 2026Data
Q4 2024
$2.2B
Q1 2025
$1.4B
Q2 2025
-$775.0M
Q3 2025
$1.5B
Q4 2025
$2.6B
Q1 2026
$1.2B
Q2 2026
$166.0M
Q3 2026
$2.4B
Operating cash flow minus capital expenditure, from cash flow statements.
What management said
Each quote matches the transcript word for word.
“And look, and as we talked about, this kind of range of 50 to 100 basis points spread between RPP and CPP will help us continue to drive improvement in the margin as we go forward.”
It states the revenue-per-piece versus cost-per-piece spread management expects to drive ongoing margin gains.
“There are no step changes, but we will be moving up out of the range as we continue to improve the business mix and drive productivity with some of the initiatives Carol outlined.”
It signals that U.S. margin improvement is expected to be gradual rather than sudden.
“As we look at Amazon shipping, we haven't seen any measurable or meaningful impact to our business since the announcement they made earlier in the summer.”
It addresses investor concern about competition from Amazon's shipping push.
“However, fourth quarter U .S. average daily volume is expected to be lower year over year, reflecting the deliberate actions we took earlier in the year to reduce Amazon volume.”
It flags that total U.S. volume will keep declining even as profit is expected to grow.
How should free cash flow and dividend coverage step up in 2027 once Driver Choice costs fall away?
Driver Choice cash costs ($1.4 billion this year) go away, free cash flow should keep improving as domestic margin rises, and the dividend is safe. — Brian Dykes
0:27:50 · Chris Weatherby, Wells Fargo · Growth algorithm
What is the long-term earnings growth algorithm now that the Amazon glide-down is done?
Volume growth plus revenue per piece outpacing cost per piece in a large premium addressable market, though no 2027 guidance until the fourth-quarter report. — Carol Tomé
0:30:56 · David Vernon, Bernstein · Margin carryover
How much incremental margin should carry into 2027 from the cost actions?
The changes are structural, and a 50 to 100 basis point spread between revenue and cost per piece should keep margins improving. — Brian Dykes, Carol Tomé
How much visibility is there on SMB and enterprise volume, and will revenue per piece stay above cost per piece next year?
They expect SMB and enterprise growth to continue into next year thanks to lower churn, and base pricing plus mix of 200 to 300 basis points should support the spread. — Carol Tomé, Brian Dykes
0:37:47 · Scott Group, Wolfe Research · U.S. margin
Can U.S. margins break out of their roughly 7.5% range, and is about 30 basis points a year the right pace?
Margins should improve every year without step changes, moving up out of the range as mix and productivity improve. — Brian Dykes
0:39:55 · Ken Hoekster, Bank of America · Volume and international
When will volumes turn positive, and is the international margin step-up bigger than gradual?
Total volume wraps Amazon declines until the second half of 2027, while international margin steps up in the fourth quarter on peak surcharges and should be mid-to-high teens next year. — Brian Dykes, Carol Tomé
0:42:48 · Jordan Alliger, Goldman Sachs · Vertical growth
How fast could the high-value verticals grow over the next several years?
Complex healthcare logistics should grow around 6% per year, data centers are a $15 billion opportunity, and automotive should outgrow GDP. — Carol Tomé, Matt Guffey
What courage-requiring decisions lie ahead, including labor?
The Teamsters contract expires August 1, 2028, and management plans a constructive approach drawing on lessons from 2023. — Carol Tomé
0:47:10 · Brandon Ogleski, Barclays · B2B and competition
What are B2B volume trends and is Amazon's shipping push adding competition?
B2B volume was down year on year but 60% of the decline was Amazon-related, and no meaningful impact from Amazon shipping has been seen. — Carol Tomé, Brian Dykes
0:49:19 · Brian Ozenbeck, J.P. Morgan · Peak and network
What does peak look like excluding Amazon, and what will the new global network leadership change?
Fourth-quarter total ADV is down 1.3% but growing excluding Amazon, and the global network will combine RFID and automation practices across regions. — Carol Tomé, Brian Dykes, Nando Cesarone
0:53:38 · Jonathan Chappelle, Evercore ISI · Cost savings
Is the $3 billion in cost savings still on track given the fourth-quarter weighting?
Yes, savings tied to hours leaving with Amazon volume, the completed driver buyout and exited buildings support the $3 billion objective. — Brian Dykes
Questions
What were UPS's headline results for Q3 2026?
Revenue was $22.9 billion, up 6.7%, with diluted EPS of $1.37 and non-GAAP adjusted diluted EPS of $1.69, compared with $1.74 a year earlier.
What is UPS guiding for the full year and fourth quarter?
For 2026 UPS expects revenue of about $92.6 billion, non-GAAP adjusted operating profit of about $8.75 billion and non-GAAP adjusted diluted EPS of about $7.28. For the fourth quarter it expects revenue of about $25.7 billion and adjusted operating profit of about $3.3 billion.
How is the U.S. Domestic segment performing?
Revenue rose 4.5% to $14,865 M and non-GAAP adjusted operating profit rose 14.3% to $1,034 M, with adjusted margin of 7.0%. Average daily volume fell 3.3% because of deliberate Amazon volume reductions.
Why did Supply Chain Solutions profit fall?
Revenue grew 18.2%, but non-GAAP adjusted operating profit fell to $274 M from $536 M, and the prior-year quarter included a $330M pre-tax sale-leaseback gain. GAAP results also included a $182 million goodwill impairment.
What is UPS's free cash flow and capital return outlook?
Nine-month non-GAAP free cash flow was $4,220 million, and the full-year target is raised to about $6.1B. UPS still expects about $3.0 billion of capital expenditures and around $5.4 billion of dividends, subject to board approval.
Good morning. My name is Matthew and I'll be your facilitator today. I'd like to welcome everyone to the UPS Third Quarter 2026 Earnings Conference Call. All lines have been placed on mute to prevent background noise, and after the speaker's remarks, there'll be a question and answer period. Any analysts who want to ask a question, now is the time to press star, then one on your telephone keypad. It is now my pleasure to turn the floor over to your host, Mr.
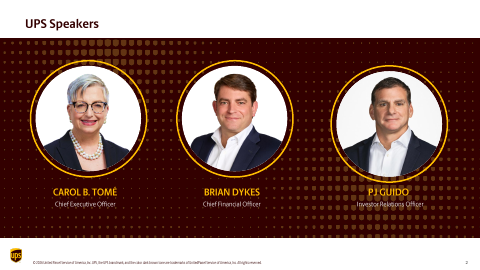
Good morning, and welcome to the UPS Third Quarter 2026 Earnings Call. Joining me today are Carol Tomé, our CEO, Brian Dykes, our CFO, and a few additional members of our executive leadership team. Before we begin, I want to remind you that some of the comments we'll make today are forward-looking statements and address our expectations for the future performance or operating results of our company. These statements are subject to risks and uncertainties, which are described in our 2025 Form 10-K and other reports we file with or furnish to the Securities and Exchange Commission.
These reports, when filed, are available on the UPS Investor Relations website and from the SEC. Unless stated otherwise, our discussion refers to adjusted results. For the third quarter of 2026, GAAP results include a net charge of $279 million, or $0.32 per diluted share, comprised of after-tax transformation strategy costs of $130 million, as well as a $182 million charge associated with a goodwill impairment in supply chain solutions, partially offset by a gain on sale of MD-11 assets of $33 million.
A reconciliation of non-GAAP adjusted amounts to GAAP financial results is available in today's webcast materials. These materials are also available on the UPS Investor Relations website. Following our prepared remarks, we will take questions from those joining us via the teleconference. If you wish to ask a question, press star and then one on your phone to enter the queue. Please ask only one question so that we may allow as many as possible to participate. You may rejoin the queue for the opportunity to ask an additional question.
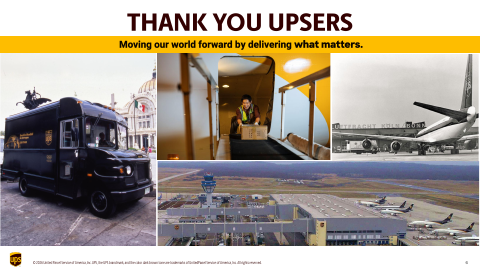
Thank you, PJ, and good morning. I'd like to begin by celebrating some important milestones that demonstrate the strength of our global integrated network. This year, UPS celebrates 50 years in Europe, 40 years at our Cologne Air Hub in Germany, 35 years in Mexico, and 25 years of flying into China. These milestones represent decades of service, commitment, and progress. To UPSers across these markets and around the world, thank you for delivering for our customers, strengthening our company, and moving UPS forward every day.
Moving to our results, the third quarter marked another quarter of strong performance that exceeded our expectations. Revenue grew across all three segments, driving consolidated revenue to $22.9 billion, up 6.7 % from last year. Consolidated operating profit was $2.1 billion. The U .S. domestic segment delivered its second consecutive quarter of strong year-over-year operating profit growth, increasing over 14 % versus the third quarter of last year. In the U .S., we are now past the inflection point on several key elements of our strategy, with clear evidence in our volume, operating profit, and operating margin performance.
Average daily volume from SMB and enterprise customers increased 1.8 % year over year. And for the second consecutive quarter, revenue per piece growth outpaced cost per piece growth, contributing to 60 basis points of year-over-year operating margin expansion in the third quarter. In international, we return to year-over-year operating profit growth for the first time since the 2025 U .S. trade policy changes. The momentum we saw in the second quarter across the China to U .S.
and Asia to Asia trade lanes continued in the third quarter, supported by investments we've made across the region. In addition, U .S. inbound volume rebounded in September, further strengthening our third quarter performance. And in supply chain solutions, both forwarding and logistics grew revenue year over year, driven by demand from customers in high-tech, health care, manufacturing, and automotive. Taken together, these results show that our strategy is working. We're driving more premium growth, improving revenue quality and mix, and creating greater operating leverage through a more efficient network.
All of this is strengthening the underlying performance of our business. As many of you saw, in September we announced a new global operating model. Under our new model, Matt Guffey leads our U .S. domestic businesses, including small package and growth enablers like the UPS Store, UPS Capital, Roadie, Happy Returns, and Mail Innovations. Wilfredo Ramos is responsible for international small package, global healthcare, and our forwarding and logistics business. And Nando Cesarone drives our global network, leading global air, network automation, and surface transportation operations that power our integrated network.
This new model enables UPS to serve customers with greater consistency, agility, and scale. Under this approach, UPS is standardizing critical operational processes across geographies while maintaining the flexibility necessary to meet the unique needs of local markets. We believe this structure will unlock new synergies across our businesses and accelerate premium growth. A good example of this alignment can be seen in the UPS store, Happy Returns, and UPS Capital. Approximately 10 % of total U .S. small package volume originates through the UPS store network, and that volume has grown by roughly 6 % annually since 2024.
Through happy returns, SMB and enterprise customers can offer consumers a convenient no-box, no-label returns experience, and every happy returns package flows through the UPS small package network. By the end of this year, happy returns volume is expected to have more than tripled since we acquired them in 2023. UPS Capital extends our value proposition beyond transportation. Through solutions like UPS Secure Commerce, we use data and AI to help customers reduce fraud, protect high-value shipments, and make smarter, more informed supply chain decisions.
Outside the U .S., we're focused on helping customers solve increasingly complex global supply chain needs while expanding our premium B2B business. On October 15th, we officially opened our new air hub at Clark International Airport in the Philippines, improving transit times across more than 1 ,100 trade lanes, and enabling next business day connectivity between key markets in Asia Pacific, India, Europe, and the United States. This investment strengthens our ability to serve customers in premium global industries, such as manufacturing, high-tech, and healthcare.
In Europe, we recently added a 129 ,000-square-foot multifunctional facility to our network. Strategically located in Amsterdam, the facility brings freight forwarding, customs brokerage, and healthcare cold chain capabilities together under one roof. We designed this facility to support our high-value B2B customers. Before we turn to PEEK, let me highlight our third quarter performance in two important growth areas, healthcare and SMBs. First, healthcare revenue exceeded $3 billion for the third consecutive quarter, with year-over-year growth in every segment.
Second, SMBs, including platforms, represented 35.1 % of total U .S. volume in the third quarter, up approximately 240 basis points from last year. In the U .S., SMB average daily volume grew 3.7 % year-over-year, driven by continued momentum in our digital access program known as DAP. And global DAP revenue reached $1.4 billion. Importantly, the DAP mix continued to shift toward more premium volume. For the first time, air services and ground commercial represented nearly 30 % of total DAP volume in the third quarter.
Turning to the holiday season, U .S. consumers remain resilient and the outlook for holiday demand is strong. Industry forecasts for holiday online retail sales project an average increase of approximately 9 % compared to last year. A little over 100 U .S. customers account for approximately 80 % of our peak surge. And based on their forecasts, we expect average daily volume to increase approximately 25 % from the third quarter to the fourth quarter. That sequential increase is consistent with last year.
However, fourth quarter U .S. average daily volume is expected to be lower year over year, reflecting the deliberate actions we took earlier in the year to reduce Amazon volume. As we head into peak, our network is more automated, more efficient, and better positioned than ever to handle the holiday surge. We'll add variable capacity where needed, but the investments we've made in our network enable us to operate with fewer vehicle rentals and aircraft leases, and nearly 70 % of all packages will flow through an automated process.
As we've discussed, we are moving from a scanning to a sensing network. Our RFID capabilities are increasing productivity with little to no scanning, while improving package visibility and on-time delivery. By the end of the year, we expect to have delivered more than 4 billion RFID-enabled packages. Beyond being ready operationally, we're also finding new ways to make the holiday experience better for our customers. We recently launched protected delivery, which adds an extra layer of security for high-value shipments by requiring a pin before the package is released.
And we're adding a little holiday spirit with special holiday-themed express packaging. In short, we are ready for peak. And while on-time service is important every day of the year, it matters even more during PEAK when our customers are counting on us to deliver for their customers. We've been the industry leader in on-time service during PEAK for the past eight years. And with our network, our know-how, and the commitment of UPSers, we're ready to make it nine.
As I wrap up, let me share our updated outlook for the year. We expect the momentum we've built to continue, giving us the confidence to raise our full-year outlook. For the full year of 2026, we now expect consolidated revenue of approximately $92.6 billion and consolidated operating profit of approximately $8.75 billion. Brian will provide more details on our outlook in a moment. Let me close with this. Real change takes courage. It takes courage to pivot when the path you've been on is familiar.
It takes courage to make difficult choices when you know there will be pain along the way. And it takes conviction to stay the course before the results are fully visible. We've experienced all of that. But now we're seeing the strategy come to life. We're seeing the proof points in our business, and we're proving something we believed in from the beginning. Better is truly better than bigger. We still have work to do, but we've moved through an important inflection point.
We know where we're going. We have momentum behind us. And I couldn't be more confident in the future we're building for UPS. Our performance over the last two quarters demonstrates that our premium growth strategy is working, positioning us to return to revenue, operating profit, and EPS growth for the full year 2026. With momentum building, we expect continued progress ahead. So with that, thank you for listening. And now I'll turn the call over to Brian.
This morning I'll cover two areas, starting with our third quarter results. Then I'll review our outlook for the full year, including capital allocation and our expectations for the fourth quarter. Our results in the third quarter demonstrate that our strategy is translating into stronger financial performance. By growing premium volume, improving revenue quality, and running a more efficient network, we are strengthening the underlying performance of the business. In the quarter, revenue growth was strong in all three segments, and we delivered operating profit and margin expansion in our small package businesses.
In the third quarter, consolidated revenue was $22.9 billion, an increase of 6.7%, and operating profit was $2.1 billion. Consolidated operating margin was 9%, and diluted earnings per share were $1.69. Our third quarter results included gains from asset sales partially offset by related expenses. On a net basis, these items were not a significant driver of the outperformance versus our expectations. Looking at the segments, in the U .S., our strategy is delivering results. We grew premium volume, improved revenue quality, and converted that growth into higher operating profit and expanded operating margin.
For the quarter, year-over-year average daily volume growth from SMB and enterprise customers exceeded our expectations, operations, increasing by more than 200 ,000 pieces per day. When looking at ground, S &B and enterprise customers increased ground ADV by 2.1 percent versus the third quarter of last year, and air average daily volume from S &B and enterprise customers was flat year-over-year. Looking at total ADV in the U .S., it was down 3.3 percent versus the third quarter of last year, reflecting the deliberate actions we took earlier in the year to reduce Amazon volume.
Demand from SMB customers was strong, with average daily volume up 3.7 % year-over-year, with growth coming from nearly all industries, including healthcare. And in the quarter, SMBs represented a record of 35.1 % of total U .S. volume. Our B2B customer mix is becoming more diversified with healthcare, high-tech, manufacturing, and automotive representing a larger share of total U .S. volume. This is a deliberate shift we have been working toward. More premium volume from industries and customers that deliver better overall economics.
Moving to revenue. In the third quarter, U .S. domestic generated $14.9 billion in revenue, an increase of 4.5 % year-over-year, overcoming the 3.3 % decline in average daily volume. Revenue per piece increased 6.1 % compared to the third quarter of last year, with about half the growth coming from base rates and customer mix improvements, with higher fuel rates contributing to the rest. Turning to cost, in the third quarter, total expense in U .S.
domestic increased 3.9 % versus the third quarter of last year, with the increase primarily coming from fuel and purchase transportation. Also in the third quarter, we wrapped up the final phase of the driver choice program, with approximately 1 ,500 participants exiting the company, mostly at the end of the quarter. In the third quarter, the growth in revenue per piece was 60 basis points higher than the growth in cost per piece, continuing the positive spread between the two and reflecting our focus on revenue quality and productivity delivered by our network reconfiguration efforts.
The U .S. domestic segment delivered over $1 billion in operating profits, a 14.3 % increase from last year. Operating margin was 7%, an increase of 60 basis points compared to the third quarter of last year. Moving to our international segment. In the third quarter, international delivered strong revenue growth and returned to year-over-year operating profit growth for the first time in six quarters. While total international average daily volume declined 8.7 percent compared to the third quarter of last year, primarily due to geopolitical tensions, our improved financial results were driven by strong revenue quality and a favorable geographic mix.
Volume trends strengthened as the quarter progressed, with the year-over-year rate of decline improving each month and September volume finishing well above July levels. Inbound US volume, which represents many of our most profitable trade lanes, returned to year-over-year growth in September. And Asia-to-Asia export volume increased for the third consecutive quarter, up 8.4 % in the third quarter compared to last year. International generated $5 billion in revenue, an increase of 7.1 % year-over-year.
Revenue growth was driven by a 15 % year-over-year increase in revenue per piece, with around half of the increase coming from fuel rates. Our fuel surcharges helped offset higher fuel expense in the quarter and preserve operating profit. Operating profit in the international segment was $746 million, an increase of $55 million year-over-year. International operating margin in the third quarter was well above our expectations at 14.9 % and slightly above the third quarter of last year.
Now moving to SCS. Supply chain solutions delivered strong revenue growth year-over-year, driven by a focus on premium volume from high-tech, healthcare, manufacturing, and automotive customers. Total supply chain solutions revenue was $3 billion, an increase of $459 million versus last year. Forwarding revenue increased 17.5 % year-over-year, driven by higher rates in international air freight and ocean freight. And ocean also grew shipments in the quarter. Logistics revenue increased 17.2 % year-over-year, driven by strong growth in healthcare logistics, partially offset by a decline in our mail innovations business.
And UPS Digital, which includes roadie and happy returns, delivered revenue growth of nearly 50 % compared to the third quarter of 2025. In the third quarter, supply chain solutions generated an operating profit of $274 million, and operating margin was 9.2%. As a reminder, FCS's third quarter 2025 results included a $330 million gain from a sale-leaseback transaction. Lastly, looking at cash and liquidity. Year-to-date, we've generated $6 billion in cash from operations and free cash flow of $4.2 billion, which includes one-time payments for the driver choice program.
We ended the third quarter with $6.8 billion in cash on the balance sheet and no outstanding commercial paper. And so far this year, UPS has paid $4.1 billion in dividends. In the third quarter, we successfully issued $1.3 billion in debt to refinance maturity and to complete a pension contribution of $450 million of UPS bonds to our pension asset portfolio. The contribution of UPS bonds to the pension further strengthened the plan's funded status and supported our pension investment strategy of reducing volatility.
Moving to our 2026 financial outlook, at the beginning of the year, we laid out a plan that contemplated a meaningfully stronger second half, including a fourth quarter that targeted revenue and operating profit growth, operating margin expansion, and EPS growth. Our third quarter performance exceeded our expectations and gives us greater confidence in the trajectory we established at the start of the year. As a result, we are raising our fourth quarter revenue and operating profit expectations and lifting our full year outlook.
Starting with full year 2026, we now expect consolidated revenue of approximately $92.6 billion and consolidated operating profit of approximately $8.75 billion. This implies full year diluted earnings per share of approximately $7.28. And for the fourth quarter, we now expect consolidated revenue of approximately $25.7 billion, up approximately 5 % year-over-year, and consolidated operating profit of approximately $3.3 billion. Now let's look at our expectations for the segments in the fourth quarter.
Starting with U .S. Domestic, we expect revenue to be up approximately 3 % year-over-year in the fourth quarter, driven by revenue per piece and premium volume growth. We expect an operating margin of approximately 10.5%. In terms of peak, the market outlook for strong holiday demand that Carol discussed, combined with the forecast we have from our largest customers, gives us confidence in a strong peak season. We expect the momentum we've seen with S &B and enterprise customers to continue as seasonal volumes ramp up in line with last year.
Peak volumes will move to our most automated, efficient, and flexible network in history. And while we are ready for the holiday surge, what matters most is the service we deliver. We've been the industry leader in on-time service during peak for the past eight years, and we intend to make it nine. Turning to international in the fourth quarter, we expect a similar macro environment to the third quarter and we expect the strong inbound U .S. volume we saw in September to continue.
With that backdrop, we expect fourth quarter revenue in international to be up approximately 7% and operating margin of approximately 20%. And in supply chain solutions, in the fourth quarter we expect revenue to be up nearly 13% and operating margin to be approximately 12.2 percent. Lastly, for modeling purposes, in total below the line in the fourth quarter, we expect approximately $190 million in expense, and we expect the tax rate to be approximately 23 % in the fourth quarter.
Turning to our expectations for cash in the balance sheet, for the full year 2026, we now expect free cash flow to be approximately $6.1 billion, which includes payments made for the Driver Choice Program. Our free cash flow expectation is higher than we originally anticipated due to the outperformance of the business and the pension contribution we made using UPS bonds. Capital expenditures are still expected to be about $3 billion. We are still planning to pay out around $5.4 billion in dividends in 2026, subject to board approval.
And we expect the tax rate for the full year to be approximately 23%. As we close out 2026, our business is performing the way we intended to perform. Grow premium volume, operate a more automated, integrated network, and drive operating profit growth. The momentum we're building across the business positions us to deliver a strong fourth quarter and an industry-leading peak. Looking ahead to 2027, the new global operating model Carol discussed will help us move faster, unlock additional efficiencies, and more fully leverage the strength of the UPS network to support profitable growth over the long term.
Thank you. We will now conduct a question and answer session. If you have any questions or comments, please press star 1 on your phone at this time. We do ask that while posing your question, please pick up your handset if you're listening on speakerphone to provide optimum sound quality. In the interest of time, we do ask that participants ask one question. And once again, if you have any questions or comments, please press star 1 on your phone.
Hey, good morning. Congratulations on some strong results here. Brian, I wanted to ask you about free cash flow expectations. I love seeing the improvement in the guide on free cash flow. So if we think about the driver choice program and take those costs out, it would imply a big step up or maybe not big, but solid step up in free cash flow for for 2027.
Recognizing you guys haven't given guidance yet for the year ahead. Just give some indication on kind of how you're thinking about what free cash flow could look like or what the magnitude of that step up could look like for 2027 and just safety around the dividend or coverage of the dividend. Thanks.
Sure, Ari, and thank you for the question. Yeah, so we did step up free cash flow. Remember, a part of that is the business performance, which the business is performing better than our initial expectations.
Part of it's also the pension contribution in the form of bonds rather than cash, which is good for our pension plan. It was also very good for our issuance. We had a very successful issuance in the quarter. As you think about how that rolls into next year, you're absolutely right. the driver choice cash requirement goes away, which will drive an improvement in free cash flow. Depending on how we fund the pension, we may then have to offset the $450 million in there.
And then obviously, look, we've always talked about the fundamental driver fee cash flow is getting the domestic margin to start moving in the right direction. I think we're showing the structural changes that we're putting in place are getting us there. That's helping to drive a free cash flow improvement in the second half and will help us as we go into 2027 where we expect free cash flow to continue to move up and improve our dividend coverage as we grow back into the dividend payout ratio that we've talked about for a long time.
Hey, thanks. Good morning, guys. Maybe kind of a big picture question. You know, Carol, you noted kind of getting through some of the big initiatives that you've been working on and then maybe getting to a sort of better opportunity for consistent growth over the longer term.
I guess if we can zoom out, I know it's a little early to talk about 27, but what do you see as the growth algorithm for UPS as we go forward? Now that the glide down is done, you're focusing on B2B, pricing is good. How do we think about all of that, and what does it mean for earnings growth over the long term?
Well, let's start with the addressable market. As we think about our addressable market, we actually think about it from manufacturing floor to the front door.
Because we serve that entire supply chain as one UPS. And if you then roll that up to what we think is addressable, it's about $922 billion. Now, clearly, we're focused on the premium side of that addressable market. So around the world, the premium opportunity is about $535 billion. And then here in the United States, if we just want to narrow it down to the premium opportunity here in the United States, it's about $150 billion. So you can see there's a lot of market for us to grow into.
And the mathematical equation of what this means for our earnings is that we expect volume growth. We expect our RPP to grow faster than our cost per piece so that we have margin expansion. We expect that not only in the United States, but we expect that in our international small package business as well. Then in supply chain solutions and our forwarding business, as you saw, we had good growth, really solid growth in the third quarter with our forwarding business up 17%.
If you look at the drivers of that, it was really in the premium space, healthcare as well as high tech. And with the explosion of data center growth here in our country, the logistics opportunities are enormous. In fact, we estimate the logistics opportunities associated with data centers alone is $15 billion. And to bring that real for the United States, in the third quarter, our high tech small package business grew 30 % year on year. Now on a small base, the 30 % year on year.
So the mathematical equation is set for us to continue to drive earnings. We're not going to give guidance today. We're going to do that at the end of the fourth quarter like we always do. But the mathematical equation, given the addressable market we have, gives us really a solid foundation to grow earnings. And I should add one more thing. We're doing it on a network that is so much more efficient than it was. And with our new global operating model, we're going to make it even more efficient.
Hey, good morning, guys. Thanks for taking the question. So, Brian, I wanted to maybe dig in a little bit on the carryover from the cost programs and efficiency efforts. And Carol, love to hear your thoughts here, too. But if we're looking at, you know, sort of second half margins around 8.9%. I think that should be a base for 2027.
I'm just wondering, as you think about the follow through from all the cost actions you've taken, you know, how does that set you up for, you know, incremental margins looking forward? I'm just trying to get a sense for, trying to see if you can help us put some guardrails around what the incremental profit outlook should look after all this noise from Amazon is behind us.
These are structural, right? Start with the volume base. In the third quarter, our core volume, so the volume outside of Amazon, grew nearly 2%, as Carol mentioned, and I said 200 ,000 pieces a day. That is structurally different volume than what we have been growing with over the last several years. That's going to provide a better foundational base, not just for revenue quality, but also to help us drive a better cost per piece outcome. The second piece, as you mentioned, we've completed now the network reconfiguration.
We finalized the driver choice program in the third quarter. We've completed the building restructuring, and we've had the hours come down commensurately with the volume. So we're on track for that completion of that program. that's going to drive this structurally better margin improvement that we saw in the third quarter and gave us the confidence to improve our fourth quarter guide. We expect that to carry over. Those are structural changes. And look, and as we talked about, this kind of range of 50 to 100 basis points spread between RPP and CPP will help us continue to drive improvement in the margin as we go forward.
On the productivity side, it's a virtuous cycle here at UPS. Yes, we have a lot of Amazon-specific related activity that we have delivered, but there's more to do on the productivity side, and I'll narrow and look at just our RFID initiative. Here, as you know, we're moving from a scanning to a sensing network, which is eliminating billions of scans and driving productivity, not just inside our operations, but with our drivers. We are moving, as you know, upstream to put the RFID labeling at the customer location, which is good for the customer because it expands the visibility of their chain of control.
It's also good for us because it reduces the amount of confusion over missed pickups and that sort of thing. We have RFID labeling at the customer location in 315 customer locations. It's about 3 million packages a day. That's growing to 6 million packages next year. So that initiative is working very, very well. And we'll continue to look at ways to drive automation and productivity in our worldwide network.
Yeah, good morning. and yeah, it's nice to see the traction on some of the initiatives and the volume side in general. I wanted to ask you about kind of how much visibility you have to that. So, you know, kind of specifically SMB volume growing. I think you were saying SMB and enterprise or B2B that growing as well. So is that something that you say, okay, if we see that in 3Q, you can extend that into first half next year or just kind of visibility on that piece?
And then I guess when we think about like CPP versus RPP next year, do you assume that you get kind of, you know, let's say 3 % base price and then you get some favorable mix on top of that? You know, like a point of mix on top, just trying to think about the kind of what keeps you above CPP next year and what are the pieces?
So we were very pleased with the growth that we saw in enterprise and SMB customers in the third quarter, and we expect to see that in the third quarter and into next year. Why? Well, one reason is our churn has shown dramatic improvement. Our team is doing an excellent job of keeping the volume that we have by meeting our customers where they need us to be. We're also growing into new opportunities by first understanding what the needs are of those industry segments and meeting those customers where they need us to be.
And most importantly, I think, is that the consumer is resilient. It's really interesting to look at what's happening with the consumer spend. It's a bit of a K-curve, for sure. If you have assets, you're spending. If you don't, you're stretched. But as long as the employment rate stays fairly stable, and it appears to be fairly stable in our country, consumers are going to spend because they have assets. And that, of course, is an important part of how you grow volume is to make sure that consumers are spending.
So it's the capabilities that we are investing in, the reduction in turn, and a good consumer environment gives us confidence about the visibility to grow. Now in terms of the spread.
Yeah, Tom, on the RPP-CPP spread, I think you're thinking about it right. Look, you'll notice that over the course of this year, the RPP level has been coming down. And we've always talked about the components of RPP, right? In the third quarter, it was 6.1 % growth.
About half of it was fuel. The other half is base rate and mix. As we wrap the Amazon declines, that mix benefit will come down, and it will normalize to something that's closer to historic levels. However, we continue to see a strong pricing environment. We announced our GRI earlier this week. It's consistent with prior years. We continue to see the ability to price for the value that we provide to our customers in these premium segments, as Carol had outlined.
And so we expect to continue to get that kind of 200 to 300 basis point base rate pricing and mix benefit as we go forward. Because while we're not defining Amazon volume, we are still growing premium volume, which helps to drive a positive product and customer segment mix going forward just at a slower pace than what we've seen in the last 18 months. Great. Thank you.
Hey, thanks. Good morning. So I just want to make sure I'm getting a big picture message on margin, right? So if you look, U .S. margins for the last three years, they've been sort of right around 7.5%. It sounds like you think we're going to see margin improvement next year. I just want to understand, like, are there big opportunities for margin improvement? Can we break out of this range and can we ever get back to like a double-digit margin?
Or should we look at Q4? You're saying U .S. margins are going to be up 30 basis points or so. Is that sort of the right magnitude of margin improvement to think about sort of going forward?
So, Scott, we absolutely think that we will be able to show steady improvement in margin as we move forward. What you see going from Q2 to Q3 and into Q4 is consistent margin improvement year over year. As we lap into next year and we get past a lot of the noise on Amazon, yeah, look, this kind of 50 to 100 basis point spread in RPP and CPP is going to help us continue to drive consistent margin improvement.
There are no step changes, but we will be moving up out of the range as we continue to improve the business mix and drive productivity with some of the initiatives Carol outlined. So that's the way you should think about it is every year improving margin. Every year improving margin. No go from seven and a half to ten in a year, but every year improve the margin because we're going to continue to lean into premium. The premium opportunity is big.
We're going to continue to drive productivity. So every year margin should get better. And I think Scott, the level of discipline that we've created around the business on what volume is right for our network and important for us, and the pricing associated with that volume will allow us to drive consistent margin improvement as we go through the next several years. Okay. Thank you, guys.
Hey, great. Good morning. Maybe just following up on some of the questions, maybe your thoughts on inflection to volumes. is when do you expect them to turn positive? I guess, do we still carry the negative comps of the Amazon through the first half? And should we then, Brian, it sounds like from your last answer, you see underlying pure pricing continuing? And then I guess, I don't know if you want to impact that. It sounds like your international margins are actually accelerating, right?
I think you said over 20%. So instead of gradual, that sounds like a bigger step up on the international side. So maybe some thoughts on all those. Thanks.
Yeah, sure. So on the volume, Ken, I think we will have the wrap of the Amazon volume on the consolidated, on the top line volume number until we get through the second half of next year. But focus on the core volume growth, right? We had nearly 2 % core volume growth in the third quarter.
We expect that to continue going into the fourth quarter, and we will continue to grow that core volume, the prices where we're leaning in as we go through 2027. On the pricing, absolutely, look, we've talked about it's a constructive pricing environment. As I mentioned, we published our GRI that's been consistent with prior years, and we continue to show this 200 to 300 basis point base pricing and mix improvement, and we expect that to continue to go forward no matter how fuel moves around, right?
On the international side, look, I think we had always contemplated a step up going into the fourth quarter. It's driven by, look, we have a peak in international as well. It's not quite 25%, but it's close to 20%, a step up in volume. And that creates a surge in demand and related demand surcharges that help us improve the margins as we go into the fourth quarter. But structurally, look, I think if you look at what we're doing both in the international side and the domestic side, better revenue quality, more efficient networks are helping us to drive consistent margin improvement.
Well, and if we look at our international business, and there's a chart posted on the website that shows volume trends by month, you can see what happened in July. When the de minimis exemption was eliminated in Europe, the volume had a sharp decline. But every month following, it's gotten better. And we actually are seeing growth in the most profitable trade lanes, which is China, U .S., Asia to Asia. So that is also helping drive the international margin in the fourth quarter.
Mid-to-high teens is the right range for that. Mid-to-high teens is the right range for the international margin as the trade lines start to settle down a bit. And we're hoping that that's actually going to happen. Thanks, Brian.
Yeah, hi. Just sort of thinking bigger picture about those high value verticals you've been talking about focused on S &B, healthcare, B2B. Can you remind perhaps how you sort of think about the growth in each category over the next several years? And then on B2B, I don't know if you mentioned explicitly, you know, we've come close to getting to an inflection on that front. Thanks.
If we can take healthcare, the projected growth rate in complex healthcare logistics is around 6 % per year. If we take data centers, I mentioned a $15 billion opportunity. The numbers are crazy. It's like supposed to double. It's supposed to double. We'll see. But the opportunity sets are large. Automotive is highly dependent upon, well, a number of factors, of course. but it should grow faster than GDP, and that's an area that we've been investing in as well.
Look, just a couple things. I think Carol hit on data centers, and I think it's, look, we continue to see that market have accelerated growth, even outpace some of what we've seen in traditional small package. The one highlight I think is, look, we're very well positioned in this data center. It's very complex. These are complex needs across the supply chain where our network, the resiliency of our network is perfectly fit to be able to handle it, to Carol's point, from factory floor to the front door because it's multimodal and across all GOs.
So we're in a really good position. On the SMB front, we're continuing to see the same growth rates that Brian and Carol highlighted. I do think it's worth noting where we're capturing growth, and it's not just volume growth within SMBs, but on our digital access program, we're capturing premium growth. So when you think about commercial and you think about also air volume, we're seeing that premium air volume come in those higher growth markets.
Thanks for taking my questions. Carol, going back to your real change takes courage commentary earlier, Certainly, the commentary from you and Brian after shows you getting the fruits of your labor into next year on the difficult decisions you've had to make over the last two years. As you look out over the next two, what courage-requiring decisions do you think UPS needs to make? And how do the strategic moves you've made in recent months and quarters put you in a position of strength when you make those decisions?
Well, Beth, thank you. And I suspect in your question, there's a question about our Teamster contract. It's important to note that that comes up for renegotiation or it expires, if you will, on August 1st of 2028. So that's a ways out, but it is in the next couple of years. Just as a reminder, we invited Teamsters into our company over 100 years ago. And our approach has always been to have a constructive relationship with Teamster leadership.
And we really do try to do that. In fact, if you go to the driver choice program that we offered earlier this year, which was an offer to buy drivers out so they could go on to retirement, Teamster leadership was pretty vocal about their displeasure with that program, I think principally because it was so well oversubscribed. And we worked with Teamster leadership and came together on a mutually satisfactory outcome. And that certainly is our approach going forward.
I will tell you something that I think is interesting. Except for our founder, Jim Casey, I believe I will be the only CEO who has negotiated two Teamster contracts. And from that, I think it gives me a distinct advantage. because there are many lessons learned from the 2023 contract negotiation. And I'm not going to go into all those lessons learned with you today, but those lessons learned position us for that contract negotiation that will happen in 2028.
Hi, good morning, and thanks for taking my question. I want to come back to B2B trends in the corner. I'm not sure if you guys addressed that, what your volumes were specifically, and then maybe more broadly about competition, because I think Amazon's obviously made a very big public push here with pricing going up. Are you seeing incremental competition for those premium verticals?
but 60 % of the decline was Amazon-related. So I'm really pleased with the underlying performance in B2B. And, Brian, is there anything you want to call out?
I would just say, look, the other important component of B2B that we don't talk about a lot, but I think is really important because it's both our SMB and our B2B strategy, is really around DAF, right? Our DAF program continues to grow tremendously. It's going to be $1.3 billion in the U .S., $1.4 billion globally in the quarter.
and we're now 30 % B2B in air, right, in the DAP program. So it's not only a driver for us to hit a different customer segment, but it's also a driver for us to continue to grow premium product mix in that customer segment. From a competitive perspective, from a first-form pricing perspective, it seems like the pricing environment is rational amongst all competitors. It seems very rational.
As it relates to Amazon itself, first of all, We have a really interesting relationship with Amazon because they're a customer, they're a supplier, and they are a competitor.
As we look at Amazon shipping, we haven't seen any measurable or meaningful impact to our business since the announcement they made earlier in the summer. And I suspect there are several reasons for that. Our networks are just different. They have a linear network. We provide reverse logistics. Their ground offer is two to five days reliable delivery. We have ground guarantees. We're just a different network. And so we're not really seeing any impact into our business, as we said today.
Now, of course, we'll pay attention to them. We pay attention to all competitors. But right now, we like the volume trends that we're seeing in our underlying business.
Hey, good morning. Thanks for taking the question. Maybe first follow up for Carol, just on the underlying volume trends in the business. I think you mentioned peak, the bigger shippers are up sort of similar quarter to quarter into the holidays, but the rest were down.
It sounded like most of that was Amazon driven. So maybe you can talk about the ex-Amazon, ex-big peakers and what that looks like for a more, I guess, granular view on the peak season. And then we'd love to hear if Nando's on the call, assuming he is. I think it was mentioned there's some more benefits from a global network. I'm assuming there's not really much structure that would change with new leadership, but we'd be interested in hearing maybe some new processes or efficiencies they're looking to drive there under the new structure.
Of course. So if I was confusing with my comments, I apologize. As we look at the volume in the fourth quarter, we have 100 customers that make up most of the surge, and based on their projections, we expect to see a 25 % lift in ADV from Q3 to Q4. But remember, we're wrapping the Amazon glide down. So total ADV will be down just slightly in the fourth quarter. But if you back out Amazon, it's growing.
Yeah, Brian, just to put some context to it. Total ADV down 1.3%. Sequentially, we're going up 4 million pieces a day from Q3 to Q4, which is a similar shape to what we've had last year and prior peaks. Now, what I would say that I think is super exciting from an EPS standpoint, when we look at peak, we actually see the opportunity to deliver a great peak, right?
Because by bringing down the water level on some difficult volume, right, it means that we are renting less trailers, releasing less aircraft. While we're hiring, we're not having to hire and trade as many people in such a short time period. So it's going to allow us to deliver a great peak for our customers, a great service peak and a great cost peak.
Yeah, thanks for the question. And, look, having spent the majority of my career overseas, I can put the two pieces together. So when you think about the United States, four years ago, we had redesigned the entire transportation network into zones and made sure that we were working on service issues or productivity issues upstream as opposed to taking those penalties in our transportation network. Since then, we've overlaid our total service plan.
I just want to give you an example of what we do here in the U .S. in terms of trying to improve productivity that we haven't taken overseas or exported yet. One of them is RFID. we actually don't scan 1.9 million packages a day that are being delivered to our customers through our RFID technology. Those targets will continue, and we're going to take the good from international, the good from the U .S. network, and put them together.
And that will build us a really strong backbone from an efficiency point of view that will allow us to cater to local customers with their last mile delivery. So right now, though, it's here and now. What's available? We're looking for quick wins, and we're building out that strategy as we move forward.
I think, Nano, you've termed it to be a single intelligent transportation utility. I love that vision. That's exactly where we're going to go. And if you take what's happening in the U .S., and we're talking a lot about cost, cost per piece and RPP.
Since we've implemented the automation, some of the technologies and different structure in terms of structural, we actually can grow volume and we're growing less resource as we grow the volume. So that is a recipe for improved margins and we look forward to what we can create globally on those same fronts.
Thank you. Good morning. Brian, from the $3 billion of cost savings, $1.8 billion through September, I know it was supposed to be back half loaded, but with 40 % for the last quarter, and especially a peak quarter, we're expecting kind of typical seasonality. Is it still kind of line of sight slam dunk, or is there a chance that it peaks better than expected and some resources are required for that, that some of that 1.2 of the final piece so that savings puzzle slips into the beginning of next year?
No, we feel comfortable with it, Jonathan, because a lot of it is related to the hours that ramps down with the Amazon volume. So remember, this was all about the volume that was leaving the network, and as those hours exit, that volume comes out. That was always going to be weighted to the last quarter of the target, and so we feel comfortable. Additionally, the driver buyout, the roughly 1 ,600 people, finished exiting at the end of the third quarter, so you get the full wrap of that, and obviously all the buildings now exited.