“Q1 revenue reached $19.9 billion between the high end of our pre-announcement and well ahead of our original outlook of $15 billion.”
Shows how far the quarter exceeded management's own original outlook.

Super Micro Computer (SMCI) · Semiconductors
Results filed 3 Nov 2026 · Quarter ended 30 Sep 2026 · Call 61 min · Charles Liang (CEO), Mark Long (CFO)
Read the transcriptSlides (19 pages)Official transcript (PDF) ↗Press release ↗Investor relations ↗
Summaries and transcripts are machine-generated and can contain errors.
Supermicro reported first quarter fiscal 2027 net sales of $19.9 billion versus $5.0 billion in Q1'26, net income of $1,594 million and non-GAAP diluted net income per common share of $1.81.
Supermicro had a record quarter. Net sales were $19.9 billion, up from $5.0 billion a year earlier and $11.1 billion in the prior quarter. Net income reached $1,594 million. About $2.3 billion of revenue was catch-up from deployments delayed from earlier quarters. AI solutions made up about 71% of revenue. One customer was 44% of revenue. Gross margin fell to 12.7% from 17.5% last quarter as large AI deployments carried lower margins. Operating cash flow was negative $434 million.
Management guided second-quarter net sales to $19.5 billion to $21.5 billion and raised the fiscal 2027 revenue range to $72.0 billion to $82.0 billion. It expects full-year gross margin of 11.8% to 12.2%, which implies a weaker second half. The main tension is that demand is strong but growth is limited by component shortages and data center readiness. Customer concentration and a lower-margin AI mix also weigh on profitability.
Open the slide deck (PDF, 19 pages) ↗
Showing the first 6 of 19 pages.
From Super Micro Computer investor relations
SEC filing
versus $5.0 billion in Q1'26
versus $168 million in Q1'26
versus $0.26 in Q1'26
versus $0.35 in Q1'26
versus 9.3% in Q1'26
versus 9.5% in Q1'26
| Segment or metric | Value | Change |
|---|---|---|
| Enterprise and channel revenue | $4.9 billion | up 229 % year-over-year, and down 12 % sequentially |
| OEM appliance and large data center revenue | $14.7 billion | up 321 % year-over-year, and 167 % sequentially |
| AI solutions share of revenue | 71 % | compared with 59 % in Q4 |
| Largest customer share of revenue | 44 % of revenue | compared with 28 % for fiscal 2026 as a whole |
| Adjusted EBITDA | $2.2B | versus $334,857 a year ago |
Copied from the press release ↗ and other documents in the SEC filing ↗. A figure is published only if its sentence is in the filing.
| From the filing | Q1 FY2027 | vs year ago | vs last quarter |
|---|---|---|---|
| Revenue | $19.9B | +297.5% | +79.4% |
| Operating income | $2.1B | +1032.7% | +38.7% |
| Net income | $1.6B | +847.3% | +35.3% |
| Diluted EPS | $1.75 | +573.1% | — |
| Free cash flow | -$475.6M | +49.9% | — |
| Gross margin | 12.7% | +3.4 pts | −4.8 pts |
| Operating margin | 10.4% | +6.8 pts | −3.0 pts |
Calculated by code from XBRL, not by the model.
| Metric | Outlook given with Q4 FY2026 | Reported | Result |
|---|---|---|---|
| Revenue | $14.5 billion and $15.5 billion | $19.9B | above the range |
| EPS (GAAP) | $0.89 to $0.98 | $1.75 | above the range |
Compared with the company's own guidance, not analyst estimates, and only where the outlook and the reported figure are the same measure on the same basis. Ranges are worked out by code from the company's wording. How this works.
| Metric | Period | Outlook |
|---|---|---|
| Net sales | second quarter of fiscal year 2027 | $19.5 billion and $21.5 billion |
| Gross margin | second quarter of fiscal 2027 | 12 % to 12.5% |
| GAAP diluted EPS | second quarter of fiscal year 2027 | $1.59 to $1.83 |
| Non-GAAP diluted EPS | second quarter of fiscal year 2027 | $1.66 to $1.90 |
| GAAP operating expenses | second quarter of fiscal 2027 | $455 million |
| Tax rate (GAAP and non-GAAP) | second quarter of fiscal year 2027 | 21.2% and 21.1% |
| Capital expenditure | second quarter of fiscal 2027 | $70 million to $80 million |
| Net sales | fiscal year 2027 | $72.0 billion to $82.0 billion |
| Gross margin | fiscal year 2027 | 11.8% - 12.2% |
| AI-related solutions share of revenue | fiscal 2027 | 70 % to 80 % |
Net sales were $19.9 billion versus $5.0 billion in Q1'26. About $2.3 billion was catch-up from earlier deployments, leaving underlying revenue of approximately $17.6 billion.
GAAP gross margin was 12.7% versus 17.5% in Q4'26. Management attributes this to the AI mix rising from 59 % to 71 % and to lower-margin deferred revenue recognized in the quarter.
Management raised the range from $65 billion to $72 billion. Full-year gross margin of 11.8% to 12.2% implies a second half below the first half.
Two customers accounted for 49 % and 17 % of accounts receivable at quarter end. Management expects concentration to stay elevated while the large buildouts run.
The cash conversion cycle improved from 149 days to 97 days, helped by deferred revenue rising about $3.1 billion. Cash used in operations was still $434 million and free cash flow was negative $481 million.
Fourth quarter worked out from the annual figure.
| Q2 FY25 | $5.7B |
| Q3 FY25 | $4.6B |
| Q4 FY25 | $5.8B * |
| Q1 FY26 | $5.0B |
| Q2 FY26 | $12.7B |
| Q3 FY26 | $10.2B |
| Q4 FY26 | $11.1B * |
| Q1 FY27 | $19.9B |
| Q2 FY25 | $0.51 |
| Q3 FY25 | $0.17 |
| Q1 FY26 | $0.26 |
| Q2 FY26 | $0.60 |
| Q3 FY26 | $0.72 |
| Q1 FY27 | $1.75 |
Fourth-quarter EPS appears once the press release is read; filings report it only for the full year.
| Q2 FY25 | 6.5% |
| Q3 FY25 | 3.2% |
| Q4 FY25 | 4.0% |
| Q1 FY26 | 3.6% |
| Q2 FY26 | 3.7% |
| Q3 FY26 | 6.1% |
| Q4 FY26 | 13.4% |
| Q1 FY27 | 10.4% |
| Q2 FY25 | -$267.3M |
| Q3 FY25 | $594.1M |
| Q4 FY25 | $840.9M |
| Q1 FY26 | -$949.8M |
| Q2 FY26 | -$45.1M |
| Q3 FY26 | -$6.7B |
| Q4 FY26 | $718.7M |
| Q1 FY27 | -$475.6M |
Operating cash flow minus capital expenditure, from cash flow statements.
Each quote matches the transcript word for word.
“Q1 revenue reached $19.9 billion between the high end of our pre-announcement and well ahead of our original outlook of $15 billion.”
Shows how far the quarter exceeded management's own original outlook.
“approximately $2.3 billion represented deployments originally scheduled for earlier periods due to customer and data center readiness. Excluding that, underlying revenue was approximately $17.6 billion.”
Separates one-time catch-up revenue from the underlying run rate.
“In the quarter, one large data center customer represented 44 % of revenue, compared with 28 % for fiscal 2026 as a whole.”
Quantifies the customer concentration risk.
“With Q1 at 12.8 percent and Q2 guided to 12 to 12.5 percent, the full year range implies gross margin in the second half below the first half.”
States directly that margins are expected to decline in the second half.
“At this point, we don't have any plans to consider equity raises.”
Addresses investor concern about dilution and funding growth.
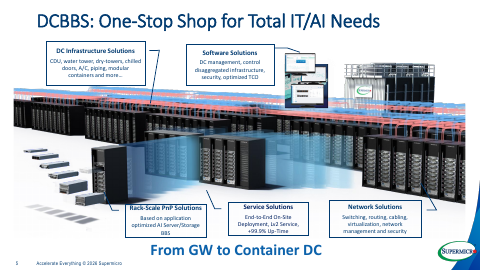
Charles Liang said DCBBS helps customers build data centers faster and he expects continued customer and market share gains. — Charles Liang
Management expects prepayments from high-quality customers to continue and pointed to shorter inventory turnaround as another cash driver. — Charles Liang, Mark Long
Mark Long said the business has a foundation near 12% gross margin with room to expand as customers and products diversify. — Charles Liang, Mark Long
Charles Liang said agentic AI is driving stronger CPU demand from enterprise customers across Intel, AMD, NVIDIA Vera and ARM-based solutions. — Charles Liang
Mark Long said the prior catch-up was unusually large and will not repeat at that magnitude, and the second-half range reflects supply constraints and data center readiness. — Mark Long, Charles Liang
Charles Liang cited component shortages and the macro economy, and Mark Long said the second-half outlook does not assume significant growth in average selling prices. — Charles Liang, Mark Long
Management said $6.9 billion of cash and a $1.8 billion facility put it in a strong position, with no plans to consider equity raises. — Charles Liang, Mark Long
Management cited a strong backlog, selectivity among customers, and better visibility from large customers and enterprise growth. — Charles Liang, Mark Long
Net sales were $19.9 billion versus $5.0 billion in Q1'26, and net income was $1,594 million. GAAP diluted EPS was $1.75 and non-GAAP diluted EPS was $1.81.
GAAP gross margin was 12.7% versus 17.5% in Q4'26. Management cited a higher AI revenue mix (71 % versus 59 %) with lower-margin large deployments and lower-margin deferred revenue recognized in the quarter.
For Q2, it expects net sales of $19.5 billion to $21.5 billion and non-GAAP diluted EPS of $1.66 to $1.90. For fiscal 2027, it raised its revenue outlook to $72.0 billion to $82.0 billion from $65 billion to $72 billion.
One large data center customer was 44 % of revenue, versus 28 % for fiscal 2026, and two customers were 49 % and 17 % of accounts receivable. Management says much of the deferred revenue reflects customer prepayments and expects concentration to moderate as enterprise and sovereign businesses grow.
It ended with $6.9 billion of cash and $8.6 billion of bank debt and convertible notes. Cash used in operations was $434 million and free cash flow was negative $481 million, though the cash conversion cycle improved from 149 days to 97 days.
Call recording on YouTube ↗. Official replay ↗. Timestamps jump to the moment.
Super Micro Computer also publishes its official transcript (PDF) ↗.
Thank you for standing by. My name is Jen and I will be your conference operator today. At this time, I would like to welcome everyone to Supermicro's first quarter fiscal year 2027 earnings call. Joining us today are Charles Liang, founder, president and chief executive officer, Mark Long, chief financial officer, former chief financial officer David Wiegand, and Michael Steger, senior vice president of corporate development. All lines have been placed on mute to prevent any background noise. After the speaker's remarks, there will be a question and answer session.
If you would like to ask a question, please press star one to raise your hand. To withdraw your question, press star one again. Thank you. Michael Steger, you may begin your conference.
Thank you, Jen. Good afternoon and welcome to Supermicro's conference call for the first quarter of fiscal 2027. As you heard with me today are Charles Liang, founder, chairman, chief executive officer, Mark Long, chief financial officer, and former chief financial officer, David Wiegand. By now, you should have received a copy of the press release from the company that was distributed at the close of regular trading and is available on the company's website.
Our call is being webcast live on Supermicro's investor relations website and will be available for replay until the conference call to discuss our potential results for the second quarter of fiscal 27. The content of today's call is Supermicro's property. It can't be reproduced or transcribed without our prior written consent. During this call, we may make forward-looking statements based on current expectations, including with respect to our business plans and performance, ongoing market trends, and future financial results.
These are subject to a number of significant risks and uncertainties, and our actual results may differ materially. For discussion of factors that could affect our future financial results in business, please refer to the disclosure in today's earnings release, our most recent Form 10-Q and the reports that we may file on Form 8-K with the Securities and Exchange Commission. All of our statements are made as of today, November 3rd, 2026, and are based on information currently available to us.
Except as required by law, we assume no obligation to update any such statements. During this call, we will discuss non-GAAP financial measures. You can find a reconciliation of these non-GAAP financial measures to GAAP financial measures in our prepared remarks, which is posted on our website. Our second quarter, fiscal 27 quiet period, begins at the close of business Friday, December 11, 2026. With that, let me turn the call over to Charles.
Thank you, Michael, and thank you all for joining us today.
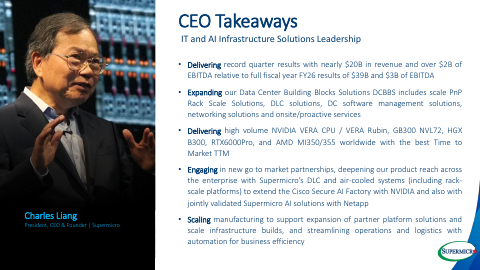
Following fiscal 2026, where we nearly double our annual revenue, fiscal 2007 is off to a record start. Q1 revenue reached $19.9 billion between the high end of our pre-announcement and well ahead of our original outlook of $15 billion. This is a great achievement, and it shows more and more customers prefer our AI and IT total solutions. Most importantly, our data center building block solution, DCBBS, are central to this growth, driven deep customer trust and preference, enhancing our profitability, and creating a sustainable long-term shareholder value.
Over for over 30 years, Supermicro's focus has always been on delivering optimized total solution value to our customers. We will continue to leverage our engineering technology, global resource, and the manufacturing capacity with high ear to accelerate the customers' deployment. Moreover, I'm glad that not just large cloud and near cloud, small cloud company, company and organization across enterprise, storage, IoT, and both country and corporate storming verticals are relying on and adopting Shibu Michael's total solution every day.
We have executed our commitment to drive higher bottom line profitability in Q1. Non-GAAP gross margin expanded by 330 basis points year over year to 12.8%. This expansion was driven by a healthier customer mix across enterprise AI and IT accounts. A diverse product line built on our system building blocks and the growing revenue contribution from our higher margin DCBPS mode, including our DCBPS hardware, software, and unique service stacks. this directly aligned with our strategic roadmap to build a sustainable double digital gross margin model by delivering superior technology innovation faster ttm and ttd faster time to market and faster time to deployment and total solution value proven over more than two years in real-world customer deployments DCBBS delivers four
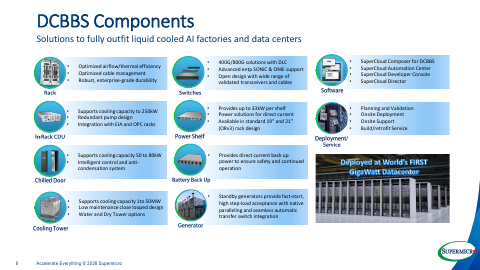
key values that not traditional server OEM and oversee CM can match first optimized TPD time to delivery by delivering factory tests product and play drug scale systems and DCBBS building block complete the solution including data center management software directly to customer side second optimize the TTO time to online for shortening life compute readiness from quarters to months and further down to weeks and third DCBBS maximize the system uptime through building block that eliminating thermal power solar air and service bottleneck and number four lower TCO by slashing energy consumption and facility hit downtime to accelerate and improve data center profitability.
Whether our customer are building gigawatt scale AI factory or deploying rapid single container part solution, SuperMakers DCBBS have built AI infrastructure faster, better, greener, and at a lower cost to our customers. Because optimized hardware alone cannot run an efficient AI data center, managing thousands of liquid-cooled GPU rack requires intelligent real-time software orchestration. SuperCloud Composer, SCM, delivers SIMDisk rack-scale management and full-stack hardware facility integration. super micro data center manager sdm provide complete power and thermal control from individual now up to floor building infrastructure for end-to-end hardware life cycle management and our super micro operation manager som suite featuring director and developer console modules enable bare metal model and token as service with ease for loram
and authentic ai workloads attaching scm sdm and som directly to our dcbps portfolio eliminates software fragmentation for our customers while driving higher-value software attachability. Furthermore, SCM enhanced call home service now features, AI-driven new-course diagnosis, significantly improving data center uptime, and giving our customers complete operational confidence. Equally critical to our total solution advantage is our new expanded global data center service organization. Here, our on-site deployment teams backed by R &D engineers and well-trained post-deployment service staff work directly alongside customers teams through TL service offering to efficiently maximize cluster uptime by using automated elementary our service team continuously monitoring thermal power delivery and not health in real time to solve a potential problem before they cost
time time while our dedicated on-site engineer handle deployment validation and immediately hardware maintenance this proactive high touch service model build deeper customer trust drive high value recurring service revenue and fulfill our highest commitment bringing a complete peace of mind to our customers through high quality infrastructure total solutions to realize this unmatched please our solution efficiency our global manufacturing footprint and scale are ramping rapidly we are actively expanding our physical footprint with major projects underway in silicon Valley and Taiwan that will add millions of square feet of fully automated production space and or active service bandwidth.
Furthermore, we are accelerating our containerized data center production in Asia and USA. Together, our global manufacturing and service network put us on track to produce more than 8 ,000 or the world's most powerful racks per month, including over 4 ,000 DLC racks by this December. On the technology front, SuperMaker continues to lead the market across major silicon platforms. We are among the first to market shipping NVIDIA Verilubin MVL72 racks with our DCBBS and DLC2 liquid cool stack.
We recently have also launched the NVIDIA Lubin and Verilubin CPU rack, and they are ready to ship now as well. By the way, our optimized DSX part solutions are also coming soon. For AMD, MI350 and MI355X platform has good demand momentum now still, as we have demands to heat us and MI450 total solutions. Additionally, we are progressing Intel Geon 6 Plus platform alongside our new ARM AGI CPU-based solutions optimized specifically for the authentic AI market.
At the same time, we continue to expand our comprehensive edge and IoT product portfolio while consistently growing our storage product line, bringing real-time complete package of influencing capability directly to the intelligent edge. These new products accelerate our strategic focus on enterprise customers as company expand toward scaling agentic model. enterprise data governance and high throughput influencing workload we recently announced several major strategic partnerships combining shibu michael's dc bbs with the world's leading technology company including cisco net app new tennis and others with additionally to one partnership coming soon we are embedding super micro dc pbs footprint deeply into the world's most trusted enterprise i know some investor and market experts have recently raised questions and concerns about ai capital expenditure
efficiency and return on investment let me be clear super micro is uniquely positioned to thrive thrive in this uh environment for over 30 years we have been focusing on the server and storage industry right here in the united states longer than almost all of our competitors building a mature where established which domestic manufacturing and engineering footprint that our competitor simply had to match. This deeper US heritage and combined with our unique DCBBS hardware, software and service total solution, directly solve the ROI challenge for our customers by optimizing ttd time to delivery tto time to online and computing uptime and energy efficiency whether our customer are building massive to one ai factory or deploying enterprise agentic ai workload super micro insure
their capital investment convert into revenue faster and more cost efficiently than anyone else we believe we are dreaming strong internal discipline through continuous operational optimization factory automation and skill development through technology process and refining refinement and the training we have successfully reduced our inventory and production turn around time from about 100 day to 74 day over the past three quarters looking ahead our target is to further steam line our inventory and production cycle down to 50 days over the coming quarters it's not easy but we believe we can we will achieve it this ongoing efficiency optimization will continue to strengthen super michael's cash flow working capital cycle and drive higher on the bottom line profitability.
Doesn't matter how competitive the market gets, more customers will love Supermicro DCBBS. That includes data center end-to-end hardware, management software, and end-to-end data center services. Now, let's turn to our outlook for fiscal year 2027. While overall demand and our growth, momentum remains very strong across every firm. We must recognize that key components shortage continue to impact delivery timeline across the IT industry, even GPU. New customer program and strategic ecosystem partnership ramping strongly.
But we want to remain prudent about some key components, availability and volatile pricing. Based on what we see today, we anticipate our fiscal 2027 revenue target will be in the range of $72 billion to $82 billion. That is about 12 % higher than the target we set one quarter ago. Before I turn the call over, I want to highlight a few important leadership updates. First, we are pleased to welcome a long-time industry technology leader, Sasha Krishnapura, to our board of directors, bringing deep data center operational experience and expertise to support our scaling.
Second, my sincere thanks to David Wagon for his six years of CFO leadership during our period of massive growth. We look forward to his ongoing support and contribution in optimizing our operation to a much bigger scale. Finally, I'm delighted to introduce Mark Long, our new CFO, who is dedicated, I guess, 30, 40 years of tech and financial leadership. We have been a strong help for our next phase of growth. Now, I will transfer the call to Mark.
Thank you, Charles, and good afternoon, everyone. This is my first call with you, so let me take two minutes before we get to the numbers. I've spent much my career in technology infrastructure finance, including as chief financial officer of a public company in this industry. What brought me to Supermicro is that the hardest part is already built. Deep engineering advantage, a real lead in liquid cooling and rack scale integration and a key position in the largest infrastructure build out of our careers.
What the company needs now is financial capability that matches its engineering and operating capabilities. I'm excited to join Supermicro at this pivotal time and look forward to helping Charles and the team continue to deliver an expanding portfolio of innovative solutions to a growing global customer base, including some of the largest, most demanding customers who are shaping the future of the AI era. To do that will require continued financial discipline, transparency, deeper engagement with stakeholders, working capital management, and capital structure optimization, which will be my areas of focus.
Now to the quarter. Total revenue was $19.9 billion, up 298 % year-over-year and 79 % sequentially. That is above our guidance range of $14.5 billion to $15.5 billion, and above the preliminary range of $18.5 billion to $19.5 billion we provided on October 20th. As Charles noted, approximately $2.3 billion represented deployments originally scheduled for earlier periods due to customer and data center readiness. Excluding that, underlying revenue was approximately $17.6 billion.
AI solutions contributed approximately 71 % of revenue, compared with 59 % in Q4. Based on our current backlog, we expect AI-related solutions to represent approximately 70 % to 80 % of revenue for fiscal 2027. Enterprise and channel revenue was $4.9 billion, or 25 % of revenue, up 229 % year-over-year, and down 12 % sequentially. OEM appliance and large data center revenue was $14.7 billion, or 74%, up 321 % year-over-year, and 167 % sequentially, driven by production ramps on several large AI data center design ways.
The 5G, telco, and edge segment, while still small in relative terms, grew significantly both year over year and sequentially. By geography, the United States represented 80 % of revenue europe 11 asia 6 and the rest of the world 3 the united states grew 771 year-over-year and 103 sequentially while the u .s remains the largest market for large-scale ai data centers we are seeing growing momentum in other regions as large customers expand globally and governments and enterprises plan and fund significant AI data centers in Europe, Asia, and the Middle East.
In the quarter, one large data center customer represented 44 % of revenue, compared with 28 % for fiscal 2026 as a whole. In our 10Q, you will also see that two customers accounted for 49 % and 17 % of accounts receivable at quarter end. I want to provide more context for this. Concentration at this level is a consequence of the scale at which AI infrastructure is now being built. A single deployment today can exceed our total quarterly revenue from just one year ago.
We expect concentration to stay elevated while these buildouts run and to moderate as our enterprise and sovereign businesses grow. What matters alongside the concentration is the quality of the exposure. So let me give you that. Deferred revenue increased by approximately $3.1 billion during the quarter. an overwhelming majority of which reflects customers paying in advance of delivery. Days sales outstanding improved from 59 days to 36 days. We recorded no material credit losses in the quarter. On large deployments, we frequently require deposits and often bill against delivery milestones.
We evaluate counterparty credit before committing manufacturing capacity and critical components. And we maintain a $1.8 billion receivables purchase facility that gives us flexibility on both cash timing and credit exposure. We have declined business in this market on terms we were not comfortable with. And in the current environment, I expect we will continue to make that choice. Non-GAAP gross margin was 12.8%. That is 200 to 240 basis points above our guidance range of 10.4 % to 10.8%.
And 330 basis points above the first quarter of last year. On a gap basis, gross margin was 12.7%. It is also down 480 basis points from the 17.6 % we reported in Q4. And I want to take that apart because a single factor explanation would be misleading. The key factor impacting gross margin was the Q1 AI revenue mix, which increased from 59 % in Q4 to 71 % in Q1. The customer and product mix within our Q1 business was weighted toward large-scale AI deployments, which carry lower gross margins than the more diversified enterprise and channel business.
Benefits from tariff relief and lower inventory reserves during the quarter were largely offset by certain lower margin deferred revenues, which were recognized during the quarter. I want to be precise about one point because I know how the mixed figures can be read. The sequential decline is not evidence that AI platform revenue lacks margin. It reflects which customers took delivery in which quarter. The clearest way to see the underlying trend is to look at the last two quarters together, which neutralizes the deferral timing.
Across Q4 and Q1 combined, revenue was approximately $31.1 billion, dollars and non-GAAP gross margin was approximately 14.5 percent. For the same two quarters a year earlier, revenue was approximately 10.8 $1 billion and gross margin was approximately 9.5 percent. On that normalized basis, revenue nearly tripled and gross margin improved by roughly 500 basis. We continue to demonstrate significant operating leverage. Revenue grew 298 % year-over-year against an 89 % increase in non-GAAP operating expenses.
GAAP operating expenses were $477 million, up 67 % year-over-year and 5 % sequentially. Non-GAAP operating expenses were $384 million up 89 % year-over-year, and 8 % sequentially. The sequential increases reflect higher headcount costs and research and development spending as we invest in multiple new platforms for AI data center and enterprise applications. Non-GAAP operating margin was 10.9 % compared with 14.3 % in Q4. Here too, the two-quarter view is more useful one.
Across Q4 and Q1 combined, non-GAAP operating expenses were approximately $741 million, or about 2.4 % of revenue, and non-GAAP operating margin was approximately 12.1%, compared with roughly 5.4 % for the same two quarters a year earlier. We intend to keep investing in R &D, field service, and our global footprint, And we expect operating expenses to keep growing well below the rate of revenue. Other income and expense was a net expense of $34 million, consisting of $49 million of interest expense and other expense offset by $83 million of interest expense on our convertible notes and revolving credit facilities.
The tax provision was $435 million on a gap basis and $455 million on a non-gap basis, with an effective tax rate of 21.4 % on both bases. I would like to expand on some points made in the last earnings call regarding earnings per share, because our capital structure now has a moving part that I do not think is well understood. we calculate earnings per share using the two-class method, which reflects the mandatory convertible preferred stock we issued in Q4.
That instrument carries a fixed dividend of approximately $75 million per quarter and converts to common stock in June 2029. Between now and then, both the dividend and the allocation of earnings to that participating security to reduce earnings available to common shareholders this quarter by approximately $312 million in aggregate. Gap diluted earnings per share were $1.75 against guidance of $0.89 to $0.98. Non-gap diluted earnings per share were $1.81 against guidance of $1.01 to $1.10.
That basic earnings per share were $1.92. Now to working capital, which I think will help explain key elements of how we operate our business. Our cash conversion cycle improved from 149 days to 97 days, a 52-day improvement in a single quarter. At our Q1 revenue run rate, That difference represents roughly $10 billion of working capital the business would otherwise have needed to fund. A cash flow statement shows this. We used $434 million of cash in operations on $19.9 billion of revenue.
For all of fiscal 2026, we used $6.8 billion on $39.1 billion of revenue. Capital expenditure in the quarter was $47 million, so free cash flow was negative $481 million against negative $7 billion for fiscal 2026. Let me break down the 52 days, including both the positives and the areas for potential improvement. Days of inventory improved 45 days to 74. Day's sales outstanding improved 23 days to 36, helped by faster collections and by customer prepayments.
Day's payable outstanding moved against us from 29 days to 13, which consumed roughly $3 billion and reflects timing of payments to suppliers in a supply-constrained environment. The largest single driver was customer prepayment. Deferred revenue increased approximately $3.1 billion in the quarter. Accounts receivable grew $3.6 billion, and inventory grew $2.5 billion to support the revenue ahead of us, and prepayments funded most of that bill. We expect the cash conversion cycle for the current quarter to be within the band of plus or minus 10 % versus Q1, which enables us to appropriately manage our working capital while also executing against attractive market opportunities.
We ended the quarter with $6.9 billion of cash and cash equivalents, bank borrowing, and convertible notes totaled $8.6 billion for net debt of $1.7 billion, compared with $1.2 billion at the end of Q4. Inventory was $15.1 billion, up from $12.9 billion, built to support the revenue we expect in coming quarters. We are in compliance with all covenants at quarter end. On capital structure more broadly, we are starting from a strong foundation.
The $5.6 billion we raised in June was raised specifically to fund the working capital behind the orders we are now delivering. As we identify high growth, high quality growth opportunities, we will optimize our capital structure to support them. and we will do that in ways that fortify the balance sheet without taking on unnecessary costs. That means matching the duration and the form of our funding to the working capital and the assets it supports and being deliberate about when and whether we access markets.
I will be transparent with you every quarter about dilution, maturities, and available capacity. We ended the quarter with a record backlog, providing stronger visibility for the current quarter and the remainder of the fiscal year. Turning to guidance, for the second quarter of fiscal 2027, we expect net sales of $19.5 billion to $21.5 billion and gross margin of 12 % to 12.5%. We expect GAAP diluted earnings per share of $1.59 to $1.83, and non-GAAP diluted earnings per share of $1.66 to $1.90.
That guidance assumes GAAP operating expenses of approximately $455 million, including approximately $102 million of stock-based compensation. which is excluded from non-GAAP. We expect other income and expense, including interest expense, to result in a net expense of approximately $58 million. GAP and non-GAAP tax rates of approximately 21% and GAAP diluted share count of approximately 753 million and a non-GAAP diluted count of approximately $769 million, preferred dividends of approximately $75 million, and capital expenditure of $70 million to $80 million.
For the full fiscal year, we are raising our revenue outlook to $72 billion to $82 billion, from $65 billion to $72 billion. dollars. We expect full year gross margin of 11.8 percent to 12.2 percent. Let me connect that to the quarter we just reported. Q1 included approximately 2.3 $1 billion of catch-up from prior period deployments. So underlying revenue was approximately 17.6 $1 billion. The full year range does not assume back catch-up repeats.
It does assume continued sequential growth in underlying demand, and it reflects materially better visibility into customer deployment schedules than we had 90 days ago. Our business continues to strengthen and momentum is building for fiscal 2027. Although we are gated by supply constraints and data center readiness, and we are focused on disciplined execution, credit-worthy counterparties, and expanding our higher margin revenue streams. On margin, I want to be straightforward about what the full year range implies. With Q1 at 12.8 percent and Q2 guided to 12 to 12.5 percent, the full year range implies gross margin in the second half below the first half.
That is a mixed effect. We expect AI solutions to move toward the upper end of the 70 % to 80 % range as the large deployments in our backlog shift, and those carry lower gross margin than enterprise and channel verticals. Within each category, we expect margins to hold or improve. What governs the range is not demand, and it is not our ability to build. It is the pace at which customer facilities become ready to receive what we have already manufactured and the availability of key components.
The binding constraints on AI buildouts across this industry right now are land, power, and data center shelves. We have better visibility into that than we did, and we will update you as the year progresses. Let me close where I started. This was a quarter of strong growth with high-quality customers. Revenue nearly quadrupled year over year. Gross margin came in well above our guidance, and customer prepayments funded most of the working capital needed to deliver it.
Behind those results is a broad and innovative portfolio from DC, VBS, RackScale, and Liquid Schooled Systems to Enterprise Storage, Edge, and Software. That positions us for the most demanding workloads and the widest range of use case in the AI buildup. My focus going forward is the one I described at the outset, financial discipline so that growth is profitable growth, transparency so that you can see how this business works from quarter to quarter, including the timing effects that moves our number.
Deeper engagement with all of our stakeholders, working capital management, building on the improvement in our cash conversion cycle this quarter, and a capital structure optimized to support high quality growth from a strong foundation. I'm looking forward to meeting many of you over the coming months. Michael, we are ready for questions.
Great. Jen, let's poll for questions.
Thank you. We will now begin the question and answer session. Please limit yourself to one question and one follow-up.
If you would like to ask a question, please press star 1 to raise your hand. To withdraw your question, press star 1 again. We ask that you pick up your handset when asking a question to allow for optimum sound quality. If you are muted locally, please remember to unmute your device. Please stand by while we compile the Q &A roster. Your first question comes from the line of Catherine Murphy with Goldman Sachs. Your line is open.
Please go ahead.
Great. Thank you for the question and great to connect. First, I want to ask just about the raised revenue outlook. Understand that land, power, and data center shells are the binding constraints here, but wanted to understand in your full year outlook and then in your pipeline, what share of those projects do you have line of sight into the offtakers and the committed volume there? And then I have a follow-up question. Thank you.
yeah i mean uh as you know uh the power and even gpu some component shortage right but because our solution outperform the industry solution so especially with our dc pps dc pps not just provide a data center hardware building broke but software and service have a customer build data center quicker and also keep their computing power uptime much better. So indeed, we continue to gain more customers and gain much share. So we feel pretty optimistic for our continual market share growth.
And then as a follow-up, could you talk more about the customer prepayments in the quarter and how we should think about that continuing to support your working capital efficiency going forward? Is that something we can expect in the value that DCBBS and the market share gain strategy that you've talked about?
Yeah, as you know, I mean, now cash flow a little bit tied to a lot of companies. But at Shibu Michael, because we have a better total solution, again, our DCBBS, that attracts a lot of customers.
So basically, we see a good sign. Most of our customers are able to pay us on time, and we feel very sorry to continue to grow our business. Mark, you may add something?
Yeah. I think the advantage, as Charles pointed out, is really around the quality of the customer base. So very large credit-worthy customers who pay very quickly, they provide very strong cash flow for us. But the broad customer base is providing more prepayments. And that discipline enables us to fund a lot more of this working capital.
and I think you should expect that to continue. So we feel like we're in very good position. The company has done a lot since they raised capital in the summer and since the cash conversion cycle has improved. So working capital efficiency has gone up substantially.
Yeah, as we just shared, we improve our business in terms of cash flow in two areas one is we improve uh inventory and production turnaround time from about 100 day to now 70 day and we believe we will be able to continue to improve that production and immediately turnaround time second phase second point another marker just say we get in have a higher quality customers and those customers pay on time or even pay a
quick turnaround. So we are very solid in this area.
Your next question comes from the line of Ananda Barua with Loop Capital. Your line is open. Please go ahead.
Yeah, thanks guys for taking the question. Congrats on the progress and And Mark, welcome. I have two if I could. I guess the first one, Mark, is just on the growth margin and the way to think about the dynamics that are layering in through the balance of the fiscal year.
Correct me if I'm wrong here. I actually have to hit the midpoint of your guide while down in the second half of the year, sort of flat around 12 % the next three quarters. So correct me if that's wrong. And then really the question is, you talked about AI mix sort of being a factor in there. Could you share a little bit about inside of the AI customer base? Like what are the moving parts on the margins?
I think Charles in the past has talked about improvement in AI margins, you know, sort of as in the go forward and just interested to know if, you know, what the dynamics at play are there as you go through the rest of the fiscal year inside the AI margins. And I have a quick follow-up. Thanks.
Yeah, as I just shared, in the last three-quarter or four-quarter, our production time and also our production quality, ERA, dramatically improve.!
And that make our turnaround time quicker and make the customer happier because of a better TTD and better TTO, help customer come to online. So customer appreciate that. Plus our DCBBS software and service that help customer forward. and better quality customer. We continue to get more customer, especially including the enterprise, Argentina customer. So all those are positive impacting our business.
Yeah, and I think just to kind of build on what Charles said, in terms of the guide for the year, what you're seeing is, you know, we have good line of sight, and now the business is stabilizing and kind of has this foundation in this 12 % gross margin range with room as we continue to diversify our customer base
and our product sets to expand those gross margins further. So, you know, the precise modeling, you know, you're relatively close on your original question. But, you know, for us, the visibility is very strong. And as Charles pointed out, the gross margin across all of our customer categories hasn't improved. That's really the important thing. And this is a function of what Charles was talking about in terms of our great engineering, our great product set, and the execution of the team.
So, you know, we feel like we're in a very good position at, you know, this scale, and we see enormous opportunities going forward.
Yeah, like our PCPPS, we provide a nine-year-old the data center, building block solution, hardware components, but also software, also help customer kind of keep up time. So all those almost become one of our business mode. So customer like our product, more and more customer like our solution.
Thanks. Really great context, guys.
And the quick follow-up is, what's the reasonable expectation for opportunity with the CPU business, you know, just with all the structural tailwinds as you go through the fiscal year here? And that's it for me. Thanks.
Yeah, as you know, authentic AI is getting really popular. So we're getting lots of customers, including lots of enterprise customers. They are buying our CPU-based solution. including Intel CPU-based AMD, including NVIDIA Vero. Our NVIDIA Vero solution is ready, and including ARM solution.
So we see a much stronger CPU demand now and looking for work.
Your next question comes from the line of Joseph Cardoso with JP Morgan. Your line is open. Please go ahead.
Hi, thanks for the questions here, and Mark, looking forward to working with you. Maybe just for my first, if I could, you know, it sounds like in your prepared remarks, you're not including any more catch-up or deferred deliveries in the guidance. But I guess maybe first question here is just, can you just clarify if there are still deferred deliveries that are remaining and just not embedded in the outlook?
And then the second portion of that question is more as we kind of strip that out of the numbers, You're still kind of implying moderation and growth coming into the second half of the year versus the first half. But maybe can you just walk us through the dynamics that are influencing that? And if it has anything to do maybe with the concentration with your largest customer here maybe fading going into the back half? And then I do have a follow-up.
Yeah, I think the key point about deferred revenue historically, kind of looking back, was that there was, you know, this set of deliveries and deployments that had been delayed, and they had been carried over from product quarters. In, you know, a typical quarter, you will have some revenue recognition based on deliveries, and you may have one or two deployments that are delayed, but, you know, those were, that was a larger than typical amount of revenue that had been deferred.
And when that was released, that caused, you know, a number of things. Revenue went up, and as we mentioned, that was margin dilutive on an overall basis. But going forward, we don't expect the same types and the same magnitude of delayed deployments through the deferred revenue. And most of the deferred revenue is either customer prepayments or, you know, we have our service and software revenue that, you know we typically differ over a number of periods
yeah the good thing is you know since we introduce the DCBBS some of our customer and some of even our internal people are little bit confused so that's why they kind of have a certain argument about when to recognize but now our DCBBS is
a much mature business so So not just our internal people now familiar with our DCBBS and customer understand which service they buy, which service they did not buy, so we should not cover that. So since it's getting much clearer, much more mature, so that we have our default revenue program.
Yeah. And the second question regarding guidance implying moderation in growth in the second half, what you're really hearing is just our sort of range of expectations based on the supply constraints and trying to gauge where the data center readiness for large deployments will land us.
But as we mentioned in the prepared remarks, demand remains extremely strong, and especially the interest in the DCBBS product portfolio.
Got it very clear. And then maybe as my second one, just dovetailing off of that a little bit, and maybe this is a two-parter as well, but you're talking about maybe shortages here going into or kind of the supply tightness, I guess, in terms of the total ecosystem. Can you maybe just touch on what's the most binding constraint as you think about the 2Q and second half outlook?
Is it largely associated with the GPUs or is it other elements on the component side? And then the second question is just more around, obviously, within this backdrop of shortages, is pricing has obviously been a strong element in terms of pass-through. Any way you can kind of help us think through as we think about your 27 outlook, how much of the growth is being driven by units as opposed to cost-passed through?
Very good question.
I mean, the reason why we have a conservative number for annual revenue, 72 to 82 billion, because we are concerning about some key components shortage and also the macro economy. So if the component shortage won't be a big issue and if the macro economy is healthy, then for sure our second half will be much bigger than our first half. So we hope to show, and that's why we are very optimistic to see our second half have a much better performance than first half.
And if that's the case, 72 to 82 billion becomes very, very conservative. Yeah.
Yeah, and I think your point about the growth in ASPs really driven by the cost of key components that it's been going up sometimes more than quarterly. You know, our outlook does not, for the second half, does not, you know, encompass significant growth in ASPs. So, you know, again, we have a relatively conservative approach there, and we're really looking at the details of customer deployments, you know, what they need, which product sets, what our production capacity is, and kind of how to manage that.
And as Charles pointed out, our demand far outstrips the availability of key components.
Your next question comes from the line of RootBlue Bhattacharya with Bank of America. Your line is open. Please go ahead.
Hi. Thanks for taking my questions. And Mark, congrats on the role, and I look forward to working with you. Maybe I'll ask you my first question. As you look out over the next 12 months, do you think Supermicro has enough cash and cashflow to self-fund the investments that are needed to support the strong growth that you're seeing?
What would cause you to raise more capital? And do you have a preference for debt versus equity? And I have a follow-up.
Very good question. As you know, by the end of the last quarter, our cash is $6 billion. Yeah. We never have so much cash in the bank. So indeed, the cash flow at this moment, we don't worry. Even if the second half continues to grow strongly if the macro economy is healthy, our cash flow is in much stronger position than before ever.
Right. Right.
Yeah, as Charles pointed out, I mean, starting with $6.9 billion of cash puts us in a very good position. As we mentioned, our working capital efficiency has gone up, our ability to fund our working capital needs through our, you know, focus on high quality customers and some customer prepayments. that puts us in a great position so that we can optimize our capital structure. We can think about trade-offs if we have very attractive opportunities that require incremental funding.
We have our $1.8 billion working capital facility. And, you know, we have the opportunity to access other markets, as you point out, both the credit and equity markets. At this point, we don't have any plans to consider equity raises. And, you know, as far as the debt markets, I think we would look at kind of, you know, what was available and how it would best position the company for continued success and provide us with the right, you know, leverage structure.
Due to time constraints, we'll be taking one final question. This question comes from! the line of George Nodder with Wolf Research. Your line is open. Please go ahead.
Hi guys, it's Brendan Rodgers on for George. I guess just a question on what's changed in your conversations with customers in the last 90 days in order to get this better visibility. Is this a feature of today's market, like customers are extending the forecast timelines that they're giving you, or is this sort of more of a shift in how you're managing the business?
As we mentioned, we have a strong back order. We have a choice to select healthy customer. Customer order quality, customer quality is very important to us. We have a chance to selective from some point of view.
Yeah, and I think as Charles pointed out, we are getting better visibility from a number of our customers, some very large, some moderately large, and we're getting visibility across geographies. And so many enterprise. Yes, and the growth of the enterprise business is another factor that will provide enhanced visibility and stability to our overall revenue stream.
We have reached the end of the Q &A session. This concludes today's call. Thank you for attending. You may now disconnect.