
Starbucks (SBUX) · Restaurants
Starbucks Q3 FY2026 earnings: summary, key numbers & outlook
Results filed 29 Jul 2026 · Quarter ended 28 Jun 2026
Slides (1 pages)Official transcript (PDF) ↗Press release ↗Investor relations ↗
Summaries and transcripts are machine-generated and can contain errors.
In brief
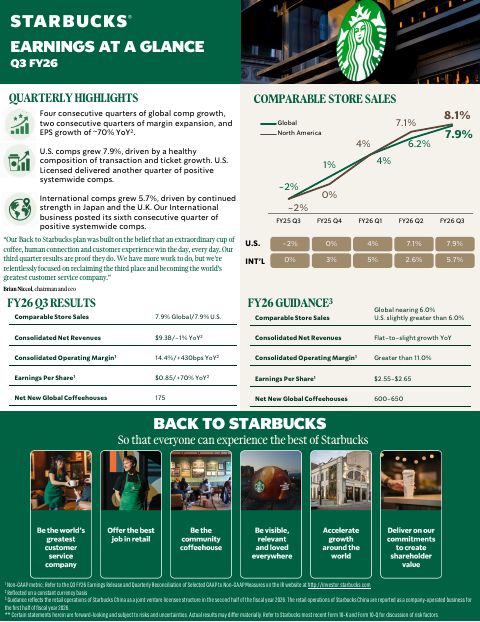
Starbucks Q3 fiscal 2026: global comparable store sales up 7.9%, consolidated net revenues down 1% to $9.3 billion, GAAP EPS $0.91 and non-GAAP EPS $0.85.
Starbucks grew sales at stores open at least 13 months by 7.9% worldwide, led by 4.2% more customer transactions. Total revenue fell 1% to $9.3 billion because the company sold control of its China stores to a joint venture in April and no longer counts those stores as its own. Non-GAAP operating margin widened to 14.4%, helped by tariff refunds and lower inflation. GAAP EPS was $0.91 and non-GAAP EPS was $0.85.
Management raised its fiscal 2026 outlook. It expects fourth-quarter U.S. comparable store sales growth of 6.5% or greater and non-GAAP EPS of $2.55 to $2.65 for the year. Revenue is expected to be flat to slightly up. The main tension is quality of earnings. Tariff refunds largely offset tariffs incurred earlier in the year, restructuring costs were high, and North America store count fell 2% from a year ago.
Slides & documents
Open the slide deck (PDF, 1 pages) ↗
From Starbucks investor relations
SEC filing
Key numbers
- Consolidated net revenues · GAAP
- $9.3 billion
- Net earnings attributable to Starbucks · GAAP
- $1.0B
- Diluted EPS · GAAP
- $0.91
- Non-GAAP diluted EPS · non-GAAP
- $0.85
- Operating income · GAAP
- $980.4M
- Non-GAAP operating income · non-GAAP
- $1.3B
- Operating margin · GAAP
- 10.5%
- Non-GAAP operating margin · non-GAAP
- 14.4%
down 1% from a year ago
up 87.2% from a year ago
up 86% over prior year
up 70% over prior year
up 4.8% from a year ago
up 40.7% from a year ago
expanded 60 basis points year-over-year
expanded 430 basis points year-over-year
| Segment or metric | Value | Change |
|---|---|---|
| North America net revenues | $7.4 billion | up 7% from Q3 FY25 |
| International net revenues | $1.3 billion | down 34% from Q3 FY25 |
| Channel Development net revenues | $587.9 million | up 22% from Q3 FY25 |
| U.S. comparable store sales | 7.9% | |
| International comparable store sales | 5.7% | |
| Global store count | 41,304 stores | 175 net new stores in Q3 |
Where each number comes from
- Consolidated net revenues: “Consolidated net revenues decreased 1% to $9.3 billion, including on a constant currency basis”
- Net earnings attributable to Starbucks: “Net earnings attributable to Starbucks | $1,045.3 | $558.3 | 87.2% | 11.2% | 5.9%”
- Diluted EPS: “GAAP earnings per share of $0.91 increased 86% over prior year”
- Non-GAAP diluted EPS: “Non-GAAP earnings per share of $0.85 expanded 70% over prior year, including on a constant currency basis”
- Operating income: “Operating income, as reported (GAAP) | $980.4 | $935.6 | 4.8% Restructuring and impairments (2) | 302.6”
- Non-GAAP operating income: “Non-GAAP operating income | $1,345.2 | $956.4 | 40.7% | 0.4% | 41.1% Operating margin, as reported”
- Operating margin: “GAAP operating margin expanded 60 basis points year-over-year to 10.5%, primarily driven by sales leverage and lower inflation paired with tariff refunds”
- Non-GAAP operating margin: “Non-GAAP operating margin expanded 430 basis points year-over-year to 14.4%, including on a constant currency basis”
- North America net revenues: “Net revenues for the North America segment increased 7% over Q3 FY25 to $7.4 billion in Q3 FY26, primarily driven by an increase in company-operated store revenue”
- International net revenues: “Net revenues for the International segment decreased 34% over Q3 FY25 to $1.3 billion in Q3 FY26, primarily driven by the conversion of Starbucks retail operations in China”
- Channel Development net revenues: “Net revenues for the Channel Development segment increased 22% over Q3 FY25 to $587.9 million in Q3 FY26, primarily due to an increase in revenue in the Global Coffee Alliance.”
- U.S. comparable store sales: “U.S. comparable store sales increased 7.9%, primarily driven by a 4.2% increase in comparable transactions and a 3.6% increase in average ticket”
- International comparable store sales: “International comparable store sales increased 5.7%, primarily driven by a 3.1% increase in average ticket and a 2.6% increase in comparable transactions”
- Global store count: “The company opened 175 net new stores in Q3, ending the period with 41,304 stores: 33% company-operated and 67% licensed”
Copied from the press release ↗ and other documents in the SEC filing ↗. A figure is published only if its sentence is in the filing.
| From the filing | Q3 FY2026 | vs year ago | vs last quarter |
|---|---|---|---|
| Revenue | $9.3B | −1.4% | −2.2% |
| Operating income | $980.4M | +4.8% | +18.4% |
| Net income | $1.0B | +87.2% | +104.6% |
| Diluted EPS | $0.91 | +85.7% | +102.2% |
| Free cash flow | $1.4B | +211.0% | +1371.1% |
| Operating margin | 10.5% | +0.6 pts | +1.8 pts |
Calculated by code from XBRL, not by the model.
Outlook
| Metric | Period | Outlook |
|---|---|---|
| U.S. comparable store sales growth | fourth quarter of fiscal 2026 | 6.5% or greater |
| U.S. comparable store sales growth | fiscal year 2026 | slightly greater than 6.0% |
| Global comparable store sales growth | fiscal year 2026 | nearing 6.0% |
| Non-GAAP consolidated operating margin | fiscal year 2026 | greater than 11.0% |
| Non-GAAP earnings per share | fiscal year 2026 | $2.55 to $2.65 |
| GAAP diluted EPS (projected) | year ended Sep 27, 2026 | $ 2.14 - 2.24 |
| Net new coffeehouses globally | fiscal year 2026 | 600 to 650 |
Key takeaways
Traffic drove comparable sales growth
Global comparable store sales increased 7.9%, primarily driven by a 4.2% increase in comparable transactions and a 3.5% increase in average ticket.
China sale cut revenue but lifted margins
Consolidated net revenues decreased 1% to $9.3 billion as China moved to a licensed joint venture, while non-GAAP operating margin expanded 430 basis points to 14.4%.
Tariff refunds flattered the quarter's margins
Starbucks received substantially all requested IEEPA tariff refunds, which largely offset related tariffs incurred in the first three quarters of fiscal 2026.
Fiscal 2026 outlook was raised
Non-GAAP EPS guidance is $2.55 to $2.65, with fourth-quarter U.S. comparable store sales growth of 6.5% or greater.
Restructuring costs and North America store count weigh
Restructuring and impairments were $302.6 million in the quarter, and North America store count was 18,371, down 2% from a year ago.
Charts
Fourth quarter worked out from the annual figure.
Data
| Q4 FY24 | $9.1B * |
| Q1 FY25 | $9.4B |
| Q2 FY25 | $8.8B |
| Q3 FY25 | $9.5B |
| Q4 FY25 | $9.6B * |
| Q1 FY26 | $9.9B |
| Q2 FY26 | $9.5B |
| Q3 FY26 | $9.3B |
Data
| Q1 FY25 | $0.69 |
| Q2 FY25 | $0.34 |
| Q3 FY25 | $0.49 |
| Q1 FY26 | $0.26 |
| Q2 FY26 | $0.45 |
| Q3 FY26 | $0.91 |
Fourth-quarter EPS appears once the press release is read; filings report it only for the full year.
Data
| Q4 FY24 | 14.4% |
| Q1 FY25 | 11.9% |
| Q2 FY25 | 6.9% |
| Q3 FY25 | 9.9% |
| Q4 FY25 | 2.9% |
| Q1 FY26 | 9.0% |
| Q2 FY26 | 8.7% |
| Q3 FY26 | 10.5% |
Data
| Q4 FY24 | $737.4M |
| Q1 FY25 | $1.4B |
| Q2 FY25 | -$297.2M |
| Q3 FY25 | $434.3M |
| Q4 FY25 | $925.8M |
| Q1 FY26 | $1.3B |
| Q2 FY26 | $91.8M |
| Q3 FY26 | $1.4B |
Operating cash flow minus capital expenditure, from cash flow statements.
Questions
What were Starbucks' key results in Q3 fiscal 2026?
Global comparable store sales rose 7.9% and consolidated net revenues fell 1% to $9.3 billion. GAAP EPS was $0.91 and non-GAAP EPS was $0.85.
Why did Starbucks' revenue fall while comparable sales rose?
The China retail business moved to a licensed joint venture in Q3, which cut company-operated store revenue. International net revenues fell 34% to $1.3 billion, while North America net revenues rose 7% to $7.4 billion.
What is Starbucks' updated fiscal 2026 guidance?
Non-GAAP EPS is expected at $2.55 to $2.65, non-GAAP operating margin above 11.0%, and revenue flat to slight growth. It also expects fourth-quarter U.S. comparable store sales growth of 6.5% or greater and about 600 to 650 net new coffeehouses.
How did Starbucks' margins change?
GAAP operating margin expanded 60 basis points to 10.5%, and non-GAAP operating margin expanded 430 basis points to 14.4%. Management cited sales leverage, lower inflation and tariff refunds, partly offset by restructuring costs and labor investments.
What happened with the China transaction and the dividend?
Starbucks completed the China transaction with Boyu Capital in April, retains a 40% ownership interest in the joint venture, and booked a $536.3 million net gain. The Board declared a cash dividend of $0.62 per share.