
Roku (ROKU) · Media & Streaming
Roku Q3 2026 earnings: summary, key numbers & outlook
Results filed 2 Nov 2026 · Quarter ended 30 Sep 2026
Slides (14 pages)Press release ↗Investor relations ↗
Summaries and transcripts are machine-generated and can contain errors.
In brief
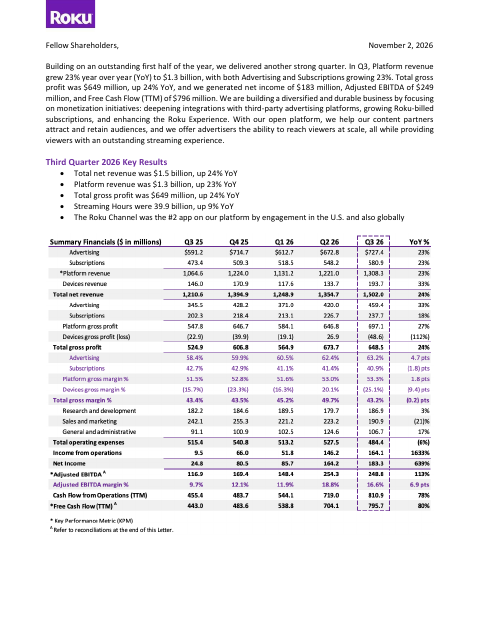
Roku's Q3 2026 total net revenue was $1.5 billion, up 24% YoY, with Platform revenue of $1.3 billion, up 23% YoY, net income of $183 million and Adjusted EBITDA of $249 million.
Roku had a strong third quarter. Total net revenue reached $1.5 billion, up 24% from a year ago. Advertising and Subscriptions each grew 23%, and Devices grew 33%. Net income was $183 million, up from $25 million a year earlier, as operating expenses fell 6% while gross profit rose 24%. Devices lost money because of elevated memory costs, but higher-margin advertising offset that loss.
Roku gave no financial outlook and held no earnings call because Fox Corporation has agreed to acquire it. Management says it remains on track for the second-half 2026 forecast in the proxy statement. It expects distribution costs for Roku TV models to be weighted toward Q4. The main risks are weak Devices margins from memory prices and uncertainty around the pending FOX deal.
Slides & documents
Open the shareholder letter (PDF, 14 pages) ↗
Showing the first 6 of 14 pages.
SEC filing
Key numbers
- Total net revenue · GAAP
- $1.5 billion
- Net income · GAAP
- $183 million
- Diluted net income per share · GAAP
- $1.20
- Total gross margin · GAAP
- 43.2%
- Income from operations · GAAP
- $164.1M
- Operating cash flow (TTM) · GAAP
- $810.9M
- Free cash flow (TTM) · non-GAAP
- $796 million
- Adjusted EBITDA · non-GAAP
- $249 million
up 24% YoY
up 639% from a year ago
up from $0.16 a year ago
(0.2)pts YoY
up from 9,466 a year ago
up 78% YoY
up 80% YoY
up 113% YoY
| Segment or metric | Value | Change |
|---|---|---|
| Advertising revenue | $727 million | up 23% YoY |
| Subscriptions revenue | $581 million | up 23% YoY |
| Devices revenue | $194 million | up 33% YoY |
| Streaming Hours | 39.9 billion | up 9% YoY |
Where each number comes from
- Total net revenue: “Total net revenue was $1.5 billion, up 24% YoY •Platform revenue was $1.3 billion, up 23% YoY •Total gross profit was $649 million, up 24% YoY”
- Net income: “Total gross profit was $649 million, up 24% YoY, and we generated net income of $183 million, Adjusted EBITDA of $249 million, and Free Cash Flow (TTM) of $796 million.”
- Diluted net income per share: “Net income per share — basic | $1.23 | $0.17 | $2.93 | $0.05 Net income per share — diluted | $1.20 | $0.16 | $2.85 | $0.05”
- Total gross margin: “Total gross margin % | 43.4% | 43.5% | 45.2% | 49.7% | 43.2% | (0.2)pts”
- Income from operations: “Income (loss) from operations | 164,088 | 9,466 | 362,035 | (71,597) Other income, net: Interest expense | (593)”
- Operating cash flow (TTM): “Net cash provided by operating activities | $455,360 | $483,718 | $544,126 | $719,037 | $810,866 Less: Purchases of property and equipment”
- Free cash flow (TTM): “Total gross profit was $649 million, up 24% YoY, and we generated net income of $183 million, Adjusted EBITDA of $249 million, and Free Cash Flow (TTM) of $796 million.”
- Adjusted EBITDA: “Total gross profit was $649 million, up 24% YoY, and we generated net income of $183 million, Adjusted EBITDA of $249 million, and Free Cash Flow (TTM) of $796 million.”
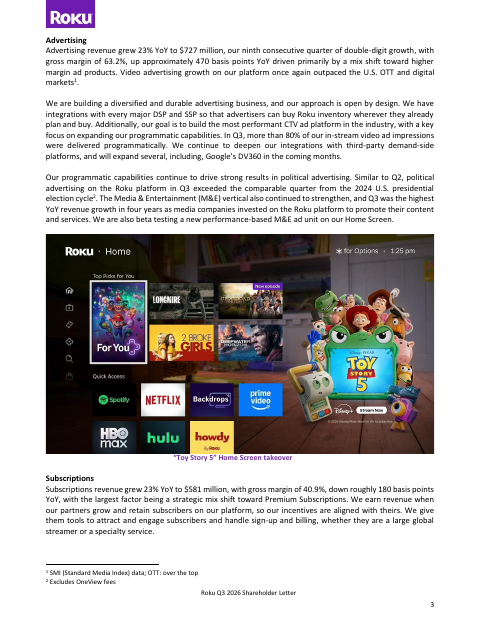
- Advertising revenue: “Advertising revenue grew 23% YoY to $727 million, our ninth consecutive quarter of double-digit growth, with gross margin of 63.2%, up approximately 470 basis points YoY”
- Subscriptions revenue: “Subscriptions revenue grew 23% YoY to $581 million, with gross margin of 40.9%, down roughly 180 basis points YoY, with the largest factor being a strategic mix shift toward Premium Subscriptions.”
- Devices revenue: “Devices revenue was $194 million, up 33% YoY, with gross margin of (25.1%), driven primarily by elevated memory costs.”
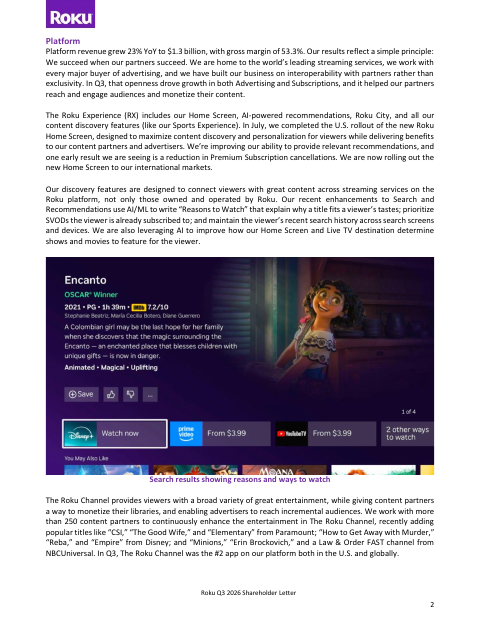
- Streaming Hours: “Streaming Hours were 39.9 billion, up 9% YoY •The Roku Channel was the #2 app on our platform by engagement in the U.S. and also globally”
Copied from the press release ↗ and other documents in the SEC filing ↗. A figure is published only if its sentence is in the filing.
| From the filing | Q3 2026 | vs year ago | vs last quarter |
|---|---|---|---|
| Revenue | $1.5B | +24.1% | +10.9% |
| Operating income | $164.1M | +1633.4% | +12.3% |
| Net income | $183.3M | +638.9% | +11.6% |
| Diluted EPS | $1.20 | +650.0% | +11.1% |
| Free cash flow | $218.0M | +72.4% | −22.4% |
| Gross margin | 43.2% | −0.2 pts | −6.5 pts |
| Operating margin | 10.9% | +10.1 pts | +0.1 pts |
Calculated by code from XBRL, not by the model.
Key takeaways
Net income jumped to $183 million
Net income was $183 million, versus $24.8 million a year earlier. Total operating expenses fell 6% while total gross profit rose 24%.
Advertising and Subscriptions both grew 23%
Advertising revenue was $727 million, its ninth consecutive quarter of double-digit growth. Subscriptions revenue was $581 million.
Advertising margin expanded on programmatic mix
Advertising gross margin was 63.2%, up approximately 470 basis points YoY on a mix shift toward higher margin ad products. More than 80% of in-stream video ad impressions were delivered programmatically.
Devices lost money on memory costs
Devices revenue rose 33% to $194 million, but gross margin was (25.1%) because of elevated memory costs. Total gross margin was 43.2%.
Pending FOX deal means no outlook
With the pending acquisition by FOX, Roku will not host an earnings call or provide a financial outlook. It says it remains on track for the second half 2026 forecast in the proxy statement.
Charts
Fourth quarter worked out from the annual figure.
Data
| Q4 2024 | $1.2B * |
| Q1 2025 | $1.0B |
| Q2 2025 | $1.1B |
| Q3 2025 | $1.2B |
| Q4 2025 | $1.4B * |
| Q1 2026 | $1.2B |
| Q2 2026 | $1.4B |
| Q3 2026 | $1.5B |
Data
| Q1 2025 | -$0.19 |
| Q2 2025 | $0.07 |
| Q3 2025 | $0.16 |
| Q1 2026 | $0.57 |
| Q2 2026 | $1.08 |
| Q3 2026 | $1.20 |
Fourth-quarter EPS appears once the press release is read; filings report it only for the full year.
Data
| Q4 2024 | -3.3% |
| Q1 2025 | -5.7% |
| Q2 2025 | -2.1% |
| Q3 2025 | 0.8% |
| Q4 2025 | 4.7% |
| Q1 2026 | 4.1% |
| Q2 2026 | 10.8% |
| Q3 2026 | 10.9% |
Data
| Q4 2024 | $76.8M |
| Q1 2025 | $136.8M |
| Q2 2025 | $108.6M |
| Q3 2025 | $126.5M |
| Q4 2025 | $106.6M |
| Q1 2026 | $196.0M |
| Q2 2026 | $280.9M |
| Q3 2026 | $218.0M |
Operating cash flow minus capital expenditure, from cash flow statements.
Questions
How did Roku perform in Q3 2026?
Total net revenue was $1.5 billion, up 24% YoY, and Platform revenue was $1.3 billion, up 23%. Net income was $183 million and Adjusted EBITDA was $249 million.
Did Roku give guidance for the next quarter?
No. Because of the pending acquisition by FOX, Roku held no earnings call and provided no financial outlook. It said it remains on track for the second half 2026 forecast in the proxy statement.
Why was the Devices gross margin negative?
Devices gross margin was (25.1%), driven primarily by elevated memory costs. Devices revenue still grew 33% YoY to $194 million.
How profitable was Roku in Q3 compared with a year ago?
Net income was $183.3 million versus $24.8 million a year earlier, and diluted EPS was $1.20 versus $0.16. Income from operations was $164.1 million versus $9.5 million.
What is Roku's free cash flow?
Trailing-twelve-month free cash flow (a non-GAAP measure) was $796 million, up 80% YoY. Trailing-twelve-month operating cash flow was $810.9 million.