
NVIDIA (NVDA) · Semiconductors
NVIDIA Q1 FY2027 earnings: summary, key numbers & outlook
Results filed 20 May 2026 · Quarter ended 26 Apr 2026
Slides (17 pages)Official transcript (PDF) ↗Press release ↗Investor relations ↗
Summaries and transcripts are machine-generated and can contain errors.
In brief
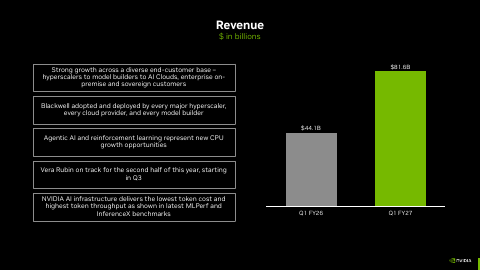
NVIDIA reported record first-quarter fiscal 2027 revenue of $81.6 billion, up 85% from a year ago, with record Data Center revenue of $75.2 billion, up 92% from a year ago.
NVIDIA's revenue for the quarter ended April 26, 2026 was a record $81.6 billion, up 20% from the previous quarter and up 85% from a year ago. Data Center, driven by Blackwell products and networking, made up $75.2 billion of that. GAAP net income of $58.3 billion was lifted by $15.9 billion of equity securities gains; non-GAAP diluted EPS was $1.87. NVIDIA returned about $20.0 billion to shareholders and raised its quarterly dividend to $0.25 per share.
For the second quarter, NVIDIA expects revenue of $91.0 billion, plus or minus 2%, with gross margins near 75.0%, and assumes no Data Center compute revenue from China. The main tension is concentration and supply: about half of Data Center revenue comes from hyperscalers, inventory and supply commitments rose to $119.0 billion, and cash taxes are expected to jump substantially in the second quarter. Consumer PC demand was also softer on high memory prices.
Slides & documents
Open the slide deck (PDF, 17 pages) ↗

Showing the first 6 of 17 pages.
From NVIDIA investor relations
- CFO CommentaryCFO commentary ↗
- TranscriptCompany's official transcript ↗
- WebcastWebcast replay ↗
- NVIDIA Quarterly Revenue TrendFinancial tables ↗
SEC filing
Key numbers
- Net income · GAAP
- $58.3B
- Diluted EPS · GAAP
- $2.39
- Diluted EPS · non-GAAP
- $1.87
- Gross margin · non-GAAP
- 75.0%
- Gross margin · GAAP
- 74.9%
- Operating income · GAAP
- $53.5B
- Net cash provided by operating activities · GAAP
- $50.3 billion
up 211% from a year ago
up 214% from a year ago
up 140% from a year ago
down 0.1 pts from prior quarter
up 14.4 pts from a year ago
up 147% from a year ago
up from $27.4 billion a year ago
| Segment or metric | Value | Change |
|---|---|---|
| Data Center | $75.2 billion | up 92% from a year ago |
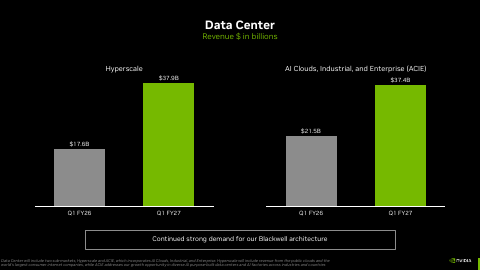
| Hyperscale | 37,869 | up 115% from a year ago |
| AI Clouds, Industrial, & Enterprise | 37,377 | up 74% from a year ago |
| Data Center compute | $60.4 billion | up 77% from a year ago |
| Data Center networking | $14.8 billion | up 199% from a year ago |
| Edge Computing | $6.4 billion | up 29% from a year ago |
| Compute & Networking | $74,550 | up 88% from a year ago |
| Graphics | 7,065 | up 58% from a year ago |
Where each number comes from
- Net income: “Net income | $58,321 | $42,960 | $18,775 | 36% | 211% Diluted earnings per share | $2.39 | $1.76 | $0.76 | 36% | 214%”
- Diluted EPS: “For the quarter, GAAP and non-GAAP earnings per diluted share were $2.39 and $1.87, respectively.”
- Diluted EPS: “For the quarter, GAAP and non-GAAP earnings per diluted share were $2.39 and $1.87, respectively.”
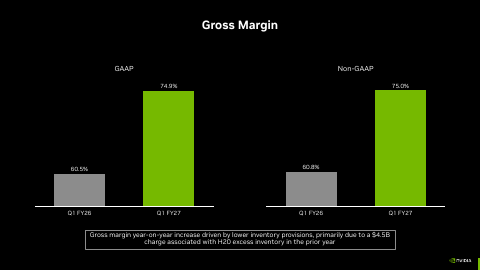
- Gross margin: “For the quarter, GAAP and non-GAAP gross margins were 74.9% and 75.0%, respectively.”
- Gross margin: “For the quarter, GAAP and non-GAAP gross margins were 74.9% and 75.0%, respectively.”
- Operating income: “Operating income | $53,536 | $44,299 | $21,638 | 21% | 147% Net income | $58,321 | $42,960 | $18,775 | 36% | 211%”
- Net cash provided by operating activities: “Cash flow from operating activities was $50.3 billion, up from $27.4 billion a year ago and up from $36.2 billion a quarter ago.”
- Data Center: “First-quarter revenue was a record $75.2 billion, up 21% from the previous quarter and up 92% from a year ago.”
- Hyperscale: “Hyperscale | 37,869 | 33,814 | 17,599 | 12% | 115% AI Clouds, Industrial, & Enterprise | 37,377 | 28,500 | 21,513 | 31% | 74%”
- AI Clouds, Industrial, & Enterprise: “Hyperscale | 37,869 | 33,814 | 17,599 | 12% | 115% AI Clouds, Industrial, & Enterprise | 37,377 | 28,500 | 21,513 | 31% | 74%”
- Data Center compute: “Data Center compute revenue was a record $60.4 billion, up 77% from a year ago and up 18% sequentially.”
- Data Center networking: “Data Center networking revenue was a record $14.8 billion, up 199% from a year ago and up 35% sequentially.”
- Edge Computing: “First-quarter Edge Computing revenue was $6.4 billion, up 10% from the previous quarter and up 29% from a year ago.”
- Compute & Networking: “Revenue by Reportable Segments ($ in millions) | Q1 FY27 | Q4 FY26 | Q1 FY26 | Q/Q | Y/Y Compute & Networking | $74,550 | $61,651 | $39,589 | 21% | 88%”
- Graphics: “Compute & Networking | $74,550 | $61,651 | $39,589 | 21% | 88% Graphics | 7,065 | 6,476 | 4,473 | 9% | 58%”
Copied from the press release ↗ and other documents in the SEC filing ↗. A figure is published only if its sentence is in the filing.
| From the filing | Q1 FY2027 | vs year ago | vs last quarter |
|---|---|---|---|
| Revenue | $81.6B | +85.2% | +19.8% |
| Operating income | $53.5B | +147.4% | +20.9% |
| Net income | $58.3B | +210.6% | +35.8% |
| Diluted EPS | $2.39 | +214.5% | — |
| Free cash flow | $48.6B | +85.5% | +39.2% |
| Gross margin | 74.9% | +14.4 pts | −0.1 pts |
| Operating margin | 65.6% | +16.5 pts | +0.6 pts |
Calculated by code from XBRL, not by the model.
Outlook
| Metric | Period | Outlook |
|---|---|---|
| Revenue | second quarter of fiscal 2027 | $91.0 billion, plus or minus 2% |
| GAAP gross margin | second quarter of fiscal 2027 | 74.9% |
| Non-GAAP gross margin | second quarter of fiscal 2027 | 75.0% |
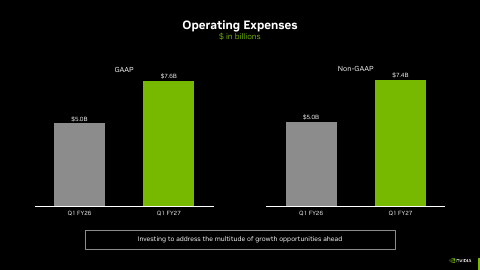
| GAAP operating expenses | second quarter of fiscal 2027 | approximately $8.5 billion |
| Non-GAAP operating expenses | second quarter of fiscal 2027 | approximately $8.3 billion |
| GAAP and non-GAAP tax rate | full year fiscal 2027 | between 16.0% and 18.0% |
Key takeaways
Data Center drove nearly all record growth
Data Center revenue was a record $75.2 billion, up 92% from a year ago, out of total revenue of $81.6 billion. Compute was $60.4 billion and networking was $14.8 billion, up 199% from a year ago.
GAAP profit inflated by equity gains
GAAP net income was $58,321 million, helped by net gains from equity securities of $15.9 billion. Non-GAAP net income was $45,548 million, and non-GAAP diluted EPS was $1.87 versus GAAP $2.39.
Customer base is diversifying beyond hyperscalers
Hyperscale revenue was approximately 50% of Data Center revenue, with the remaining 50% from AI Clouds, industrial, enterprise, and sovereign customers. AI Clouds, Industrial, & Enterprise grew 31% sequentially.
Shareholder returns stepped up sharply
NVIDIA returned approximately $20.0 billion to shareholders in the quarter, approved an additional $80.0 billion repurchase authorization, and raised its quarterly dividend from $0.01 per share to $0.25 per share.
Q2 outlook assumes no China compute revenue
NVIDIA guided second-quarter revenue to $91.0 billion, plus or minus 2%, with gross margins near 75.0%. It assumes no Data Center compute revenue from China, and no Hopper shipments to China occurred this quarter versus $4.6 billion a year ago.
Charts
Fourth quarter worked out from the annual figure.
Data
| Q3 FY25 | $35.1B |
| Q4 FY25 | $39.3B * |
| Q1 FY26 | $44.1B |
| Q2 FY26 | $46.7B |
| Q3 FY26 | $57.0B |
| Q4 FY26 | $68.1B * |
| Q1 FY27 | $81.6B |
| Q2 FY27 | $96.2B |
Data
| Q3 FY25 | $0.78 |
| Q1 FY26 | $0.76 |
| Q2 FY26 | $1.08 |
| Q3 FY26 | $1.30 |
| Q1 FY27 | $2.39 |
| Q2 FY27 | $2.46 |
Fourth-quarter EPS appears once the press release is read; filings report it only for the full year.
Data
| Q3 FY25 | 62.3% |
| Q4 FY25 | 61.1% |
| Q1 FY26 | 49.1% |
| Q2 FY26 | 60.8% |
| Q3 FY26 | 63.2% |
| Q4 FY26 | 65.0% |
| Q1 FY27 | 65.6% |
| Q2 FY27 | 66.2% |
Data
| Q3 FY25 | $16.8B |
| Q4 FY25 | $15.6B |
| Q1 FY26 | $26.2B |
| Q2 FY26 | $13.5B |
| Q3 FY26 | $22.1B |
| Q4 FY26 | $34.9B |
| Q1 FY27 | $48.6B |
| Q2 FY27 | $21.4B |
Operating cash flow minus capital expenditure, from cash flow statements.
Questions
What were NVIDIA's key results for Q1 fiscal 2027?
Revenue was a record $81.6 billion, up 85% from a year ago, with Data Center at $75.2 billion, up 92%. GAAP and non-GAAP diluted EPS were $2.39 and $1.87, and gross margins were 74.9% and 75.0%.
What is NVIDIA's guidance for the second quarter of fiscal 2027?
Revenue is expected to be $91.0 billion, plus or minus 2%, with GAAP and non-GAAP gross margins of 74.9% and 75.0%, plus or minus 50 basis points. Operating expenses are expected at approximately $8.5 billion GAAP and $8.3 billion non-GAAP, with no China Data Center compute revenue assumed.
Why was GAAP EPS so much higher than non-GAAP EPS?
GAAP net income included $15.9 billion of net gains from equity securities, mostly unrealized gains. Non-GAAP results exclude those gains, giving diluted EPS of $1.87 versus $2.39 GAAP.
What is NVIDIA doing for shareholders?
NVIDIA returned approximately $20.0 billion through buybacks and dividends in the quarter. It approved an additional $80.0 billion repurchase authorization and raised the quarterly dividend from $0.01 to $0.25 per share, payable June 26, 2026.
How is NVIDIA changing how it reports its business?
It now reports two market platforms, Data Center and Edge Computing, with Data Center split into Hyperscale and AI Clouds, Industrial, & Enterprise (ACIE). Non-GAAP measures also no longer exclude stock-based compensation expense.