
Netflix (NFLX) · Media & Streaming
Netflix Q2 2026 earnings: summary, key numbers & outlook
Results filed 16 Jul 2026 · Quarter ended 30 Jun 2026
Slides (14 pages)Official transcript (PDF) ↗Press release ↗Investor relations ↗
Summaries and transcripts are machine-generated and can contain errors.
In brief
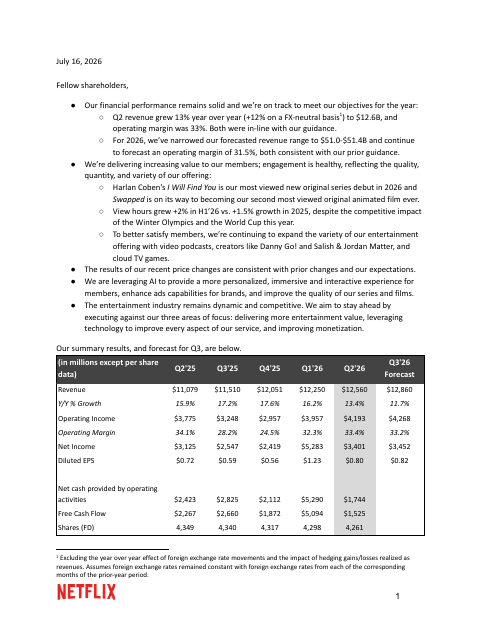
Q2 revenue grew 13% year over year (+12% on a FX-neutral basis) to $12.6B, and operating margin was 33%, with diluted EPS of $0.80.
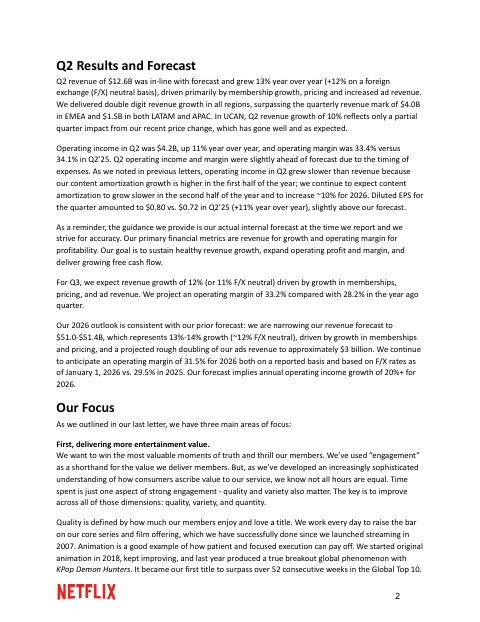
Netflix grew revenue 13% to $12.6B in the second quarter, driven by membership growth, pricing and advertising. Operating income was $4.2B and operating margin was 33.4%, slightly below 34.1% a year earlier because content amortization grew faster than revenue. Diluted EPS was $0.80. Free cash flow fell to $1.5B, partly on higher cash taxes tied to the Warner Bros. termination fee. Netflix also bought back a record $4.7B of stock.
Management expects Q3 revenue growth of 12% and an operating margin of 33.2%. It narrowed 2026 revenue guidance to $51.0-$51.4B and kept its 31.5% margin target. The main tension is that US and Canada growth slowed to 10% while content costs rise, so the margin target relies on slower amortization growth in the second half and on advertising roughly doubling to about $3 billion. Netflix will also stop publishing view hours with earnings.
Slides & documents
Open the shareholder letter (PDF, 14 pages) ↗
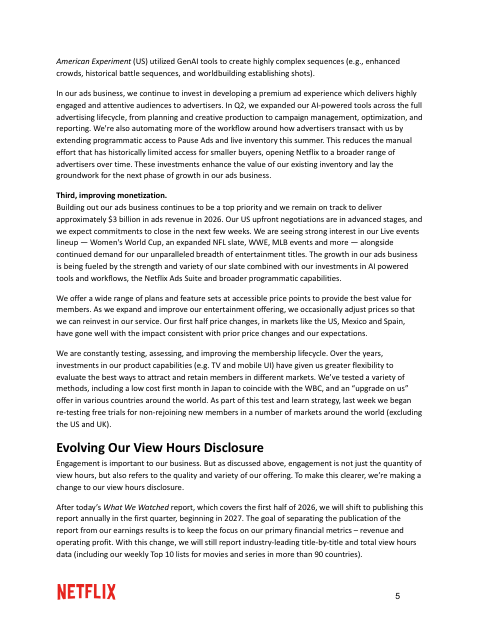
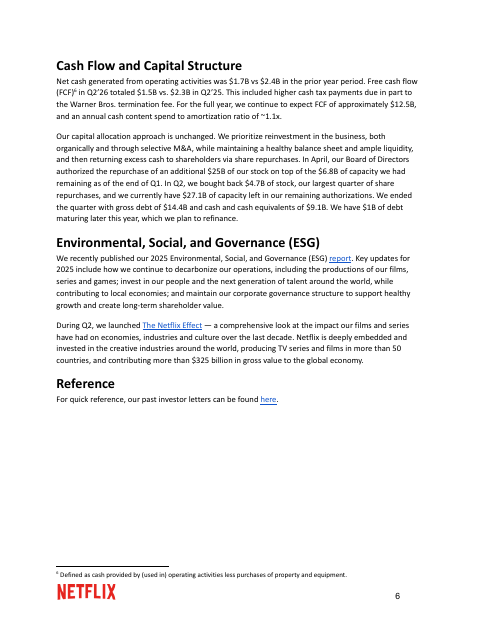
Showing the first 6 of 14 pages.
From Netflix investor relations
- TranscriptCompany's official transcript ↗
- Financial StatementsFinancial tables ↗
- Video InterviewDocument ↗
SEC filing
Key numbers
- Revenue · GAAP
- $12.6B
- Operating income · GAAP
- $4.2B
- Operating margin · GAAP
- 33.4%
- Net income · GAAP
- $3.4B
- Diluted EPS · GAAP
- $0.80
- Net cash from operating activities · GAAP
- $1.7B
- Free cash flow · non-GAAP
- $1.5B
grew 13% year over year (+12% on a foreign exchange (F/X) neutral basis)
up 11% year over year
versus 34.1% in Q2’25
vs. $0.72 in Q2’25 (+11% year over year)
vs $2.4B in the prior year period
vs. $2.3B in Q2’25
| Segment or metric | Value | Change |
|---|---|---|
| UCAN revenue | $5,432 | Y/Y growth of 10% |
| EMEA revenue | $4,034 | Y/Y growth of 14% |
| LATAM revenue | $1,584 | Y/Y growth of 21% |
| APAC revenue | $1,510 | Y/Y growth of 16% |
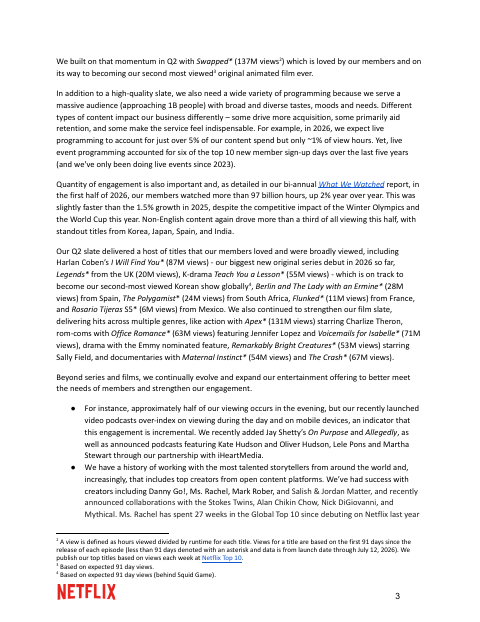
| View hours, first half of 2026 | more than 97 billion hours | up 2% year over year |
Where each number comes from
- Revenue: “Q2 revenue of $12.6B was in-line with forecast and grew 13% year over year (+12% on a foreign exchange (F/X) neutral basis), driven primarily by membership growth, pricing and increased ad revenue.”
- Operating income: “Operating income in Q2 was $4.2B, up 11% year over year, and operating margin was 33.4% versus 34.1% in Q2’25.”
- Operating margin: “Operating income in Q2 was $4.2B, up 11% year over year, and operating margin was 33.4% versus 34.1% in Q2’25.”
- Net income: “Net income | $3,401,414 | $5,282,791 | $3,125,413 | $8,684,205 | $6,015,764”
- Diluted EPS: “Diluted EPS for the quarter amounted to $0.80 vs. $0.72 in Q2’25 (+11% year over year), slightly above our forecast.”
- Net cash from operating activities: “Net cash generated from operating activities was $1.7B vs $2.4B in the prior year period.”
- Free cash flow: “Free cash flow (FCF)10 in Q2’26 totaled $1.5B vs. $2.3B in Q2’25.”
- UCAN revenue: “UCAN: Revenue | $4,929 | $5,072 | $5,339 | $5,245 | $5,432 Y/Y % Growth | 15% | 17% | 18% | 14% | 10%”
- EMEA revenue: “EMEA: Revenue | $3,538 | $3,699 | $3,873 | $3,998 | $4,034 Y/Y % Growth | 18% | 18% | 18% | 17% | 14%”
- LATAM revenue: “LATAM: Revenue | $1,307 | $1,371 | $1,418 | $1,497 | $1,584 Y/Y % Growth | 9% | 10% | 15% | 19% | 21%”
- APAC revenue: “APAC: Revenue | $1,305 | $1,369 | $1,421 | $1,509 | $1,510 Y/Y % Growth | 24% | 21% | 17% | 20% | 16%”
- View hours, first half of 2026: “in the first half of 2026, our members watched more than 97 billion hours, up 2% year over year.”
Copied from the press release ↗ and other documents in the SEC filing ↗. A figure is published only if its sentence is in the filing.
| From the filing | Q2 2026 | vs year ago | vs last quarter |
|---|---|---|---|
| Revenue | $12.6B | +13.4% | +2.5% |
| Operating income | $4.2B | +11.1% | +6.0% |
| Net income | $3.4B | +8.8% | −35.6% |
| Diluted EPS | $0.80 | +11.1% | −35.0% |
| Free cash flow | $1.5B | −32.7% | −70.1% |
| Operating margin | 33.4% | −0.7 pts | +1.1 pts |
Calculated by code from XBRL, not by the model.
Outlook
| Metric | Period | Outlook |
|---|---|---|
| Revenue growth | Q3 2026 | 12% |
| Operating margin | Q3 2026 | 33.2% |
| Diluted EPS | Q3 2026 | $0.82 |
| Revenue | 2026 | $51.0-$51.4B |
| Operating margin | 2026 | 31.5% |
| Free cash flow | 2026 | approximately $12.5B |
| Ads revenue | 2026 | approximately $3 billion |
| Content amortization growth | 2026 | ~10% |
Key takeaways
Revenue growth slowed to 13% in Q2
Q2 revenue was $12.6B, up 13% (+12% FX-neutral), versus 16.2% growth in Q1'26. All regions grew double digits.
UCAN growth slowed to 10% before price change
UCAN revenue growth of 10% reflects only a partial quarter of the recent price change. EMEA grew 14%, LATAM 21% and APAC 16%.
Margin dipped on front-loaded content amortization
Operating margin was 33.4% versus 34.1% in Q2'25. Management expects content amortization to grow slower in the second half and to rise ~10% for 2026.
Cash flow fell while buybacks hit a record
Free cash flow was $1.5B versus $2.3B a year ago, including higher cash taxes tied to the Warner Bros. termination fee. Netflix repurchased $4.7B of stock and has $27.1B of capacity left.
2026 outlook narrowed but not raised
Revenue guidance is now $51.0-$51.4B with a 31.5% operating margin, and ads are expected to reach approximately $3 billion. Netflix will publish its view hours report annually from 2027.
Charts
Fourth quarter worked out from the annual figure.
Data
| Q4 2024 | $10.2B * |
| Q1 2025 | $10.5B |
| Q2 2025 | $11.1B |
| Q3 2025 | $11.5B |
| Q4 2025 | $12.1B * |
| Q1 2026 | $12.2B |
| Q2 2026 | $12.6B |
| Q3 2026 | $12.9B |
Data
| Q1 2025 | $0.66 |
| Q2 2025 | $0.72 |
| Q3 2025 | $0.59 |
| Q1 2026 | $1.23 |
| Q2 2026 | $0.80 |
| Q3 2026 | $0.87 |
Fourth-quarter EPS appears once the press release is read; filings report it only for the full year.
Data
| Q4 2024 | 22.2% |
| Q1 2025 | 31.7% |
| Q2 2025 | 34.1% |
| Q3 2025 | 28.2% |
| Q4 2025 | 24.5% |
| Q1 2026 | 32.3% |
| Q2 2026 | 33.4% |
| Q3 2026 | 34.6% |
Data
| Q4 2024 | $1.4B |
| Q1 2025 | $2.7B |
| Q2 2025 | $2.3B |
| Q3 2025 | $2.7B |
| Q4 2025 | $1.9B |
| Q1 2026 | $5.1B |
| Q2 2026 | $1.5B |
| Q3 2026 | $2.9B |
Operating cash flow minus capital expenditure, from cash flow statements.
Questions
What were Netflix's Q2 2026 revenue and operating margin?
Revenue was $12.6B, up 13% year over year (+12% FX-neutral), and operating margin was 33.4% versus 34.1% in Q2'25. Operating income was $4.2B, up 11%.
What is Netflix guiding for Q3 2026?
Netflix expects revenue growth of 12% (11% FX-neutral) and an operating margin of 33.2%, versus 28.2% a year earlier. The forecast table shows revenue of $12,860 million and diluted EPS of $0.82.
Did Netflix change its full-year 2026 outlook?
It narrowed revenue guidance to $51.0-$51.4B, consistent with its prior forecast, and kept the 31.5% operating margin. It also still expects about $12.5B of free cash flow and about $3 billion of ads revenue.
Why did free cash flow decline in Q2?
Free cash flow was $1.5B versus $2.3B in Q2'25. Netflix attributed this partly to higher cash tax payments, including tax related to the Warner Bros. termination fee.
How much did Netflix return to shareholders in Q2?
Netflix repurchased $4.7B of stock, its largest quarter of buybacks. The board added $25B of authorization in April, leaving $27.1B of capacity.