
Cloudflare (NET) · Software
Cloudflare Q2 2026 earnings: summary, key numbers & outlook
Results filed 6 Aug 2026 · Quarter ended 30 Jun 2026
Slides (10 pages)Official transcript (PDF) ↗Press release ↗Investor relations ↗
Summaries and transcripts are machine-generated and can contain errors.
In brief
Cloudflare reported second quarter revenue of $696.1 million, up 36% year-over-year, with a GAAP loss from operations of $205.7 million and non-GAAP income from operations of $96.1 million.
Cloudflare's second-quarter revenue was $696.1 million, up 36% from a year ago. Current RPO, a measure of contracted future revenue, grew 35%. Non-GAAP income from operations was $96.1 million, or 13.8% of revenue. The GAAP loss from operations widened to $205.7 million, mainly because of $150.7 million of restructuring and other charges. Free cash flow was $56.4 million, or 8% of revenue, and the company held $4,162.8 million of cash and securities.
Management expects third-quarter revenue of $736.0 to $737.0 million and full-year revenue of $2,864.0 to $2,870.0 million. Non-GAAP income from operations is guided to $443.0 to $445.0 million for the year. The main tension is margins: non-GAAP gross margin fell to 73.1% from 76.3% a year ago, and non-GAAP operating margin was 13.8% against 14.1%. That leaves the company betting on an AI-first reorganization and agentic-internet demand to pay off.
Slides & documents
Open the slide deck (PDF, 10 pages) ↗
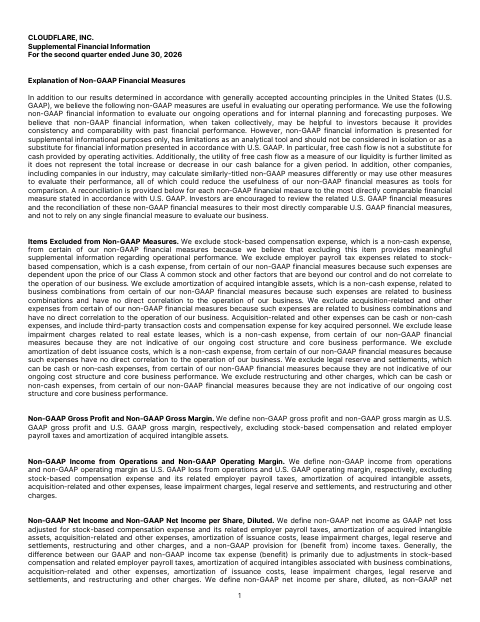
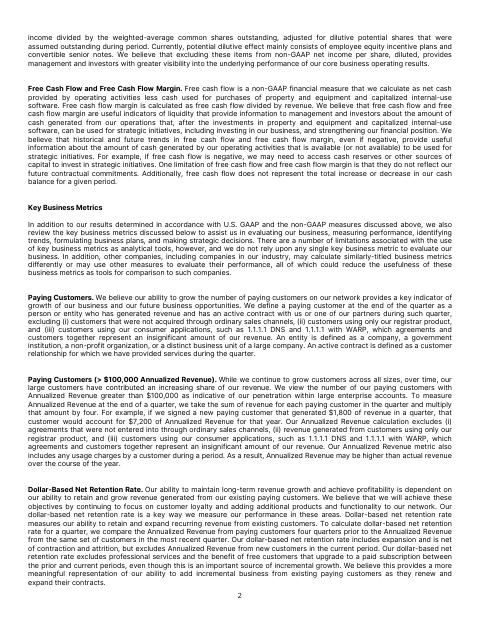
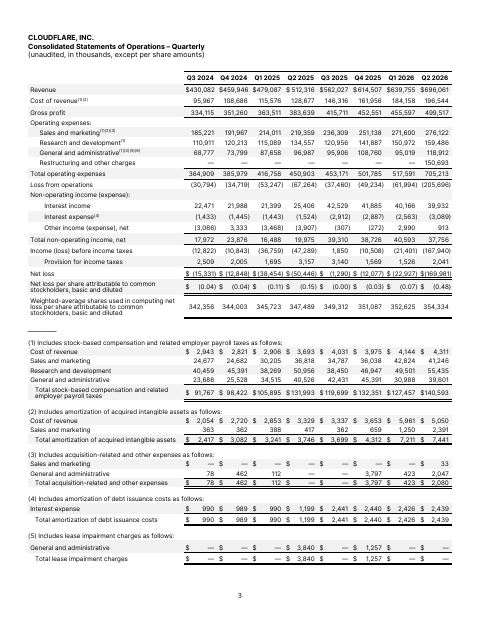
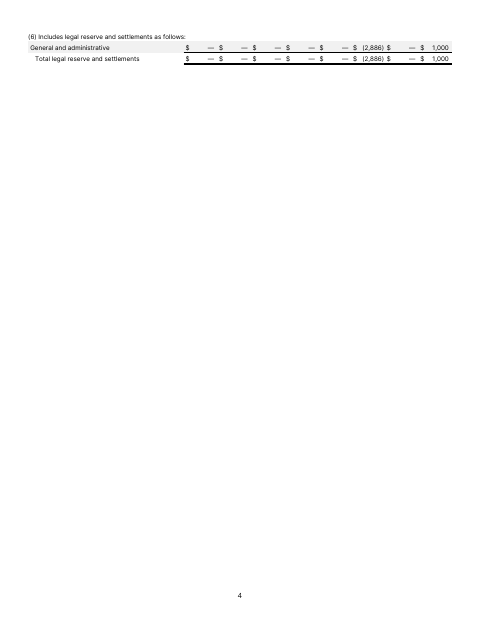
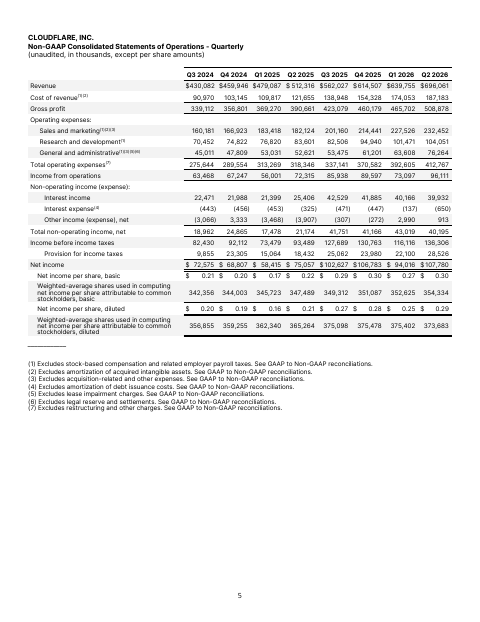
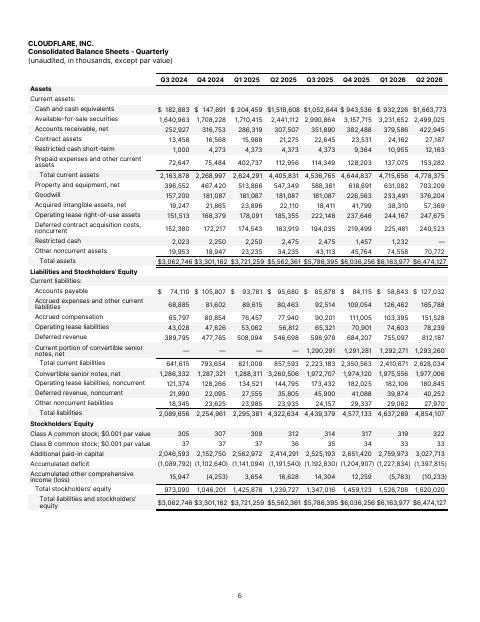
Showing the first 6 of 10 pages.
From Cloudflare investor relations
SEC filing
Key numbers
- Total revenue
- $696.1 million
- GAAP net loss · GAAP
- $170.0 million
- GAAP net loss per basic and diluted share · GAAP
- $0.48
- Non-GAAP net income per diluted share · non-GAAP
- $0.29
- GAAP gross margin · GAAP
- 71.8%
- Non-GAAP gross margin · non-GAAP
- 73.1%
- GAAP loss from operations · GAAP
- $205.7 million
- Non-GAAP income from operations · non-GAAP
- $96.1 million
up 36% year-over-year
compared to $50.4 million in the second quarter of 2025
compared to $0.15 in the second quarter of 2025
compared to $0.21 in the second quarter of 2025
compared to 74.9% in the second quarter of 2025
compared to 76.3% in the second quarter of 2025
compared to $67.3 million in the second quarter of 2025
compared to $72.3 million in the second quarter of 2025
| Segment or metric | Value | Change |
|---|---|---|
| Current RPO year-over-year growth | 35% | |
| Cash, cash equivalents, and available-for-sale securities | $4,162.8 million |
Where each number comes from
- Total revenue: “Second quarter revenue totaled $696.1 million, representing an increase of 36% year-over-year”
- GAAP net loss: “GAAP net loss was $170.0 million, compared to $50.4 million in the second quarter of 2025.”
- GAAP net loss per basic and diluted share: “GAAP net loss per basic and diluted share was $0.48, compared to $0.15 in the second quarter of 2025.”
- Non-GAAP net income per diluted share: “Non-GAAP net income per diluted share was $0.29, compared to $0.21 in the second quarter of 2025.”
- GAAP gross margin: “GAAP gross profit was $499.5 million, or 71.8% gross margin, compared to $383.6 million, or 74.9%, in the second quarter of 2025.”
- Non-GAAP gross margin: “Non-GAAP gross profit was $508.9 million, or 73.1% gross margin, compared to $390.7 million, or 76.3%, in the second quarter of 2025.”
- GAAP loss from operations: “GAAP loss from operations was $205.7 million, or 29.6% of revenue, compared to $67.3 million, or 13.1% of revenue, in the second quarter of 2025.”
- Non-GAAP income from operations: “Non-GAAP income from operations was $96.1 million, or 13.8% of revenue, compared to $72.3 million, or 14.1% of revenue, in the second quarter of 2025.”
- Current RPO year-over-year growth: “Delivered Current RPO year-over-year growth of 35% San Francisco, CA, August 6, 2026”
- Cash, cash equivalents, and available-for-sale securities: “Cash, cash equivalents, and available-for-sale securities were $4,162.8 million as of June 30, 2026.”
Copied from the press release ↗ and other documents in the SEC filing ↗. A figure is published only if its sentence is in the filing.
| From the filing | Q2 2026 | vs year ago | vs last quarter |
|---|---|---|---|
| Revenue | $696.1M | +35.9% | +8.8% |
| Operating income | -$205.7M | −205.8% | −231.8% |
| Net income | -$170.0M | −237.0% | −641.4% |
| Diluted EPS | -$0.48 | −220.0% | −585.7% |
| Free cash flow | $67.6M | +69.4% | −27.4% |
| Gross margin | 71.8% | −3.1 pts | +0.6 pts |
| Operating margin | -29.6% | −16.5 pts | −19.9 pts |
Calculated by code from XBRL, not by the model.
Outlook
| Metric | Period | Outlook |
|---|---|---|
| Total revenue | third quarter of fiscal 2026 | $736.0 to $737.0 million |
| Non-GAAP income from operations | third quarter of fiscal 2026 | $129.0 to $130.0 million |
| Non-GAAP net income per share | third quarter of fiscal 2026 | $0.34 |
| Total revenue | full year fiscal 2026 | $2,864.0 to $2,870.0 million |
| Non-GAAP income from operations | full year fiscal 2026 | $443.0 to $445.0 million |
| Non-GAAP net income per share | full year fiscal 2026 | $1.25 to $1.26 |
Key takeaways
Revenue growth accelerated to 36%
Revenue reached $696.1 million, up 36% year-over-year, compared with $512.3 million in revenue a year earlier. Sequentially, revenue rose from $639.8 million in the first quarter of 2026.
Restructuring drove the wider GAAP loss
GAAP loss from operations was $205.7 million, including $150.7 million of restructuring and other charges tied to a plan to move to an agentic AI-first operating model. Non-GAAP income from operations was $96.1 million.
Gross margin continues to compress
Non-GAAP gross margin was 73.1%, compared to 76.3% a year ago, and GAAP gross margin was 71.8% versus 74.9%. Cost of revenue grew faster than revenue.
Free cash flow improved to 8% of revenue
Free cash flow was $56.4 million, up from $33.3 million a year ago, as purchases of property and equipment fell to $49,961 thousand from $59,897 thousand.
Guidance implies steady revenue growth ahead
Management guided third-quarter revenue to $736.0 to $737.0 million and full-year revenue to $2,864.0 to $2,870.0 million. Full-year non-GAAP income from operations is expected at $443.0 to $445.0 million.
Charts
Fourth quarter worked out from the annual figure.
Data
| Q4 2024 | $459.9M * |
| Q1 2025 | $479.1M |
| Q2 2025 | $512.3M |
| Q3 2025 | $562.0M |
| Q4 2025 | $614.5M * |
| Q1 2026 | $639.8M |
| Q2 2026 | $696.1M |
| Q3 2026 | $782.5M |
Data
| Q1 2025 | -$0.11 |
| Q2 2025 | -$0.15 |
| Q3 2025 | $0.00 |
| Q1 2026 | -$0.07 |
| Q2 2026 | -$0.48 |
| Q3 2026 | -$0.10 |
Fourth-quarter EPS appears once the press release is read; filings report it only for the full year.
Data
| Q4 2024 | -7.5% |
| Q1 2025 | -11.1% |
| Q2 2025 | -13.1% |
| Q3 2025 | -6.7% |
| Q4 2025 | -8.0% |
| Q1 2026 | -9.7% |
| Q2 2026 | -29.6% |
| Q3 2026 | -8.7% |
Data
| Q4 2024 | $54.2M |
| Q1 2025 | $59.9M |
| Q2 2025 | $39.9M |
| Q3 2025 | $82.5M |
| Q4 2025 | $105.2M |
| Q1 2026 | $93.1M |
| Q2 2026 | $67.6M |
| Q3 2026 | $93.6M |
Operating cash flow minus capital expenditure, from cash flow statements.
Questions
What were Cloudflare's second-quarter 2026 revenue and growth?
Revenue was $696.1 million, up 36% year-over-year. Current RPO grew 35% year-over-year.
Was Cloudflare profitable in the second quarter?
On a GAAP basis, no: it reported a net loss of $170.0 million, or $0.48 per share, including $150.7 million of restructuring and other charges. On a non-GAAP basis, it earned $107.8 million, or $0.29 per diluted share.
What is Cloudflare's guidance for the third quarter?
Cloudflare expects third-quarter revenue of $736.0 to $737.0 million, non-GAAP income from operations of $129.0 to $130.0 million, and non-GAAP net income per share of $0.34.
What is Cloudflare's full-year 2026 outlook?
It expects revenue of $2,864.0 to $2,870.0 million, non-GAAP income from operations of $443.0 to $445.0 million, and non-GAAP net income per share of $1.25 to $1.26.
How did margins and cash flow trend?
Non-GAAP gross margin fell to 73.1% from 76.3% a year ago, and non-GAAP operating margin was 13.8% versus 14.1%. Free cash flow rose to $56.4 million, or 8% of revenue, from $33.3 million, or 6%.