
JPMorgan Chase (JPM) · Banking
JPMorgan Chase Q2 2026 earnings: summary, key numbers & outlook
Results filed 14 Jul 2026 · Quarter ended 30 Jun 2026
Slides (13 pages)Official transcript (PDF) ↗Press release ↗Investor relations ↗
Summaries and transcripts are machine-generated and can contain errors.
In brief
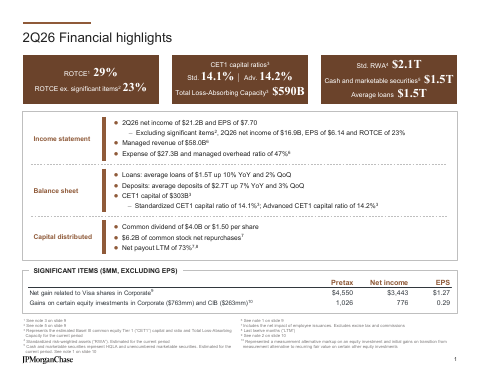
JPMorganChase reported second-quarter 2026 net income of $21.2 billion ($7.70 per share), net income excluding significant items of $16.9 billion ($6.14 per share)
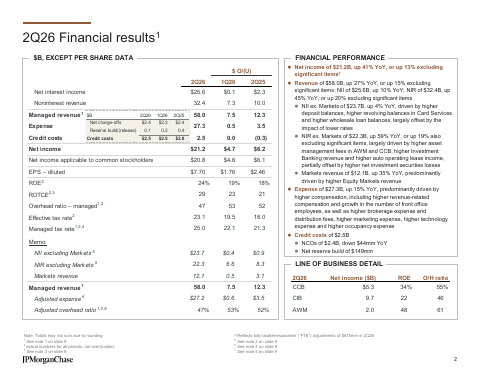
JPMorgan Chase earned $21.2 billion, or $7.70 per share, in the second quarter, up 41% from a year ago. Revenue was $57.3 billion as reported. The results include a $4.6 billion net gain on Visa shares and $1.0 billion of gains on equity investments. Without those items, net income was $16.9 billion, or $6.14 per share. Markets revenue rose 35% and investment banking fees rose 30%. Every line of business posted record revenue.
The release gives no numeric guidance for coming quarters. CEO Jamie Dimon cited a resilient U.S. economy, helped by AI-driven investment, fiscal stimulus and lighter regulation. He also warned of risks shifting below the surface: geopolitical tensions, sticky inflation, large global fiscal deficits and elevated asset prices. Expenses rose 15% to $27.3 billion, and a lot of the quarter's strength came from elevated market activity that may not last.
Slides & documents
Open the slide deck (PDF, 13 pages) ↗

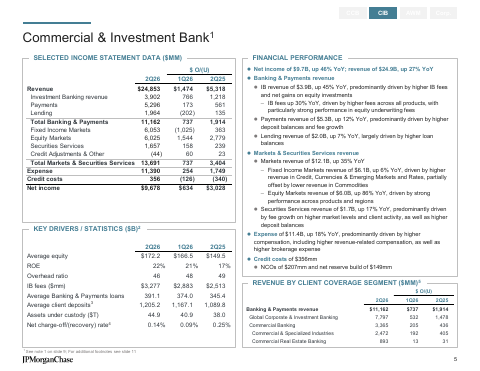
Showing the first 6 of 13 pages.
From JPMorgan Chase investor relations
- 2Q26 Earnings TranscriptCompany's official transcript ↗
- 2Q26 Earnings SupplementFinancial tables ↗
- 2Q26 10-QDocument ↗
SEC filing
Key numbers
- Net revenue (reported) · GAAP
- $57.3 billion
- Net income · GAAP
- $21.2 billion
- Diluted EPS · GAAP
- $7.70
- EPS excluding significant items · non-GAAP
- $6.14
- Net income excluding significant items · non-GAAP
- $16.9 billion
- Noninterest expense · GAAP
- $27.3 billion
up 28% from a year ago
up 41% from a year ago
up 47% from a year ago
up 13% from a year ago
up 15% from a year ago
| Segment or metric | Value | Change |
|---|---|---|
| Consumer & Community Banking net revenue | $20.3 billion | up 8% |
| Commercial & Investment Bank net revenue | $24.9 billion | up 27% |
| Asset & Wealth Management net revenue | $6.9 billion | up 19% |
| Corporate net revenue | $6.0 billion | up $4.5 billion |
| Markets revenue | $12.1 billion | up 35% |
| Investment Banking fees | $3.3 billion | up 30% |
| Assets under management | $5.1 trillion | up 18% |
Where each number comes from
- Net revenue (reported): “Reported revenue of $57.3 billion and managed revenue2 of $58.0 billion n | Expense of $27.3 billion; reported overhead ratio of 48% and managed overhead ratio2 of 47%”
- Net income: “Net income was $21.2 billion, up 41%, or up 13% excluding significant items.”
- Diluted EPS: “JPMORGANCHASE REPORTS SECOND-QUARTER 2026 NET INCOME OF $21.2 BILLION ($7.70 PER SHARE), NET INCOME EXCLUDING SIGNIFICANT ITEMS OF $16.9 BILLION ($6.14 PER SHARE)”
- EPS excluding significant items: “a decrease of $1.56 per share to reported EPS from $7.70 to $6.14 and a decrease of 6 percentage points to reported ROTCE from 29% to 23%”
- Net income excluding significant items: “generating net income of $16.9 billion and an ROTCE of 23%, excluding gains related to Visa and certain equity investments”
- Noninterest expense: “Noninterest expense was $27.3 billion, up 15%, predominantly driven by higher compensation, including higher revenue-related compensation and growth in the number of front office employees”
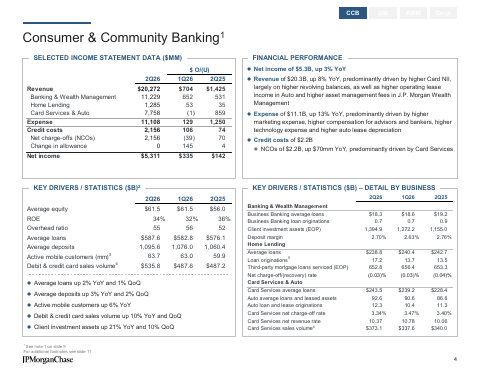
- Consumer & Community Banking net revenue: “Net income was $5.3 billion, up 3%. Net revenue was $20.3 billion, up 8%.”
- Commercial & Investment Bank net revenue: “Net income was $9.7 billion, up 46%. Net revenue was $24.9 billion, up 27%.”
- Asset & Wealth Management net revenue: “Net revenue was $6.9 billion, up 19%, driven by growth in management fees on higher average market levels and strong net inflows”
- Corporate net revenue: “Net revenue was $6.0 billion, up $4.5 billion, or down $805 million excluding significant items.”
- Markets revenue: “Markets revenue was $12.1 billion, up 35%, predominantly driven by higher Equity Markets revenue.”
- Investment Banking fees: “Investment Banking fees were $3.3 billion, up 30%, driven by higher fees across all products, with particularly strong performance in equity underwriting fees.”
- Assets under management: “Assets under management were $5.1 trillion, up 18%, and client assets were $7.7 trillion, up 19%, driven by higher market levels and continued net inflows.”
Copied from the press release ↗ and other documents in the SEC filing ↗. A figure is published only if its sentence is in the filing.
| From the filing | Q2 2026 | vs year ago | vs last quarter |
|---|---|---|---|
| Revenue | $57.3B | +27.7% | +15.1% |
| Net income | $21.2B | +41.2% | +28.3% |
| Diluted EPS | $7.70 | +46.9% | +29.6% |
Calculated by code from XBRL, not by the model.
Key takeaways
Visa and equity gains inflated reported profit
Reported net income was $21.2 billion, but excluding a $4.6 billion net gain related to Visa shares and $1.0 billion of gains on certain equity investments it was $16.9 billion. Excluding these items, EPS was $6.14 versus $7.70 reported.
Equity Markets drove the Commercial & Investment Bank
Markets revenue was $12.1 billion, up 35%, with Equity Markets revenue up 86% and Fixed Income Markets up 6%. CIB net income was $9.7 billion, up 46%.
Investment banking fees hit highest since 2021
Investment Banking fees were $3.3 billion, up 30%, with particularly strong equity underwriting. JPMorgan ranks #1 for Global Investment Banking fees with 9.3% wallet share YTD.
Expenses grew 15%, mostly compensation
Noninterest expense was $27.3 billion, up 15%, driven by higher compensation, brokerage expense and distribution fees, and marketing. The managed overhead ratio was 47%.
Capital stayed strong while returning cash
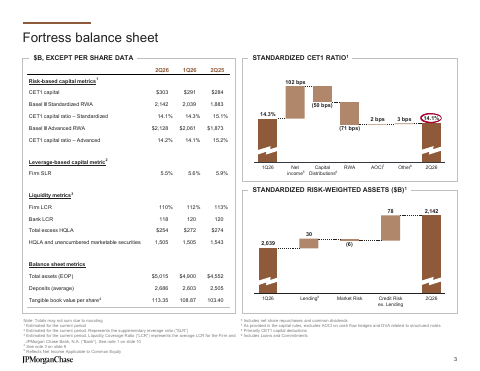
The CET1 Standardized ratio was 14.1% after a $4.0 billion common dividend and $6.2 billion of net repurchases. Book value per share was $133.01, up 9% YoY.
Charts
Fourth quarter worked out from the annual figure.
Data
| Q4 2024 | $42.8B * |
| Q1 2025 | $45.3B |
| Q2 2025 | $44.9B |
| Q3 2025 | $46.4B |
| Q4 2025 | $45.8B * |
| Q1 2026 | $49.8B |
| Q2 2026 | $57.3B |
| Q3 2026 | $50.2B |
Data
| Q1 2025 | $5.07 |
| Q2 2025 | $5.24 |
| Q3 2025 | $5.07 |
| Q1 2026 | $5.94 |
| Q2 2026 | $7.70 |
| Q3 2026 | $5.57 |
Fourth-quarter EPS appears once the press release is read; filings report it only for the full year.
Questions
What were JPMorgan Chase's Q2 2026 headline results?
Net income was $21.2 billion ($7.70 per share) on reported revenue of $57.3 billion. Excluding significant items, net income was $16.9 billion ($6.14 per share).
How much of Q2 2026 profit came from one-time gains?
A $4.6 billion net gain related to Visa shares added $1.27 to EPS. $1.0 billion of gains on certain equity investments added $0.29 to EPS.
Which businesses grew fastest in Q2 2026?
Commercial & Investment Bank revenue rose 27% to $24.9 billion, with Markets up 35% and Investment Banking fees up 30%. Asset & Wealth Management revenue rose 19%, and Consumer & Community Banking revenue rose 8%.
How is JPMorgan's credit quality and capital position?
Credit costs were $2.5 billion, including $2.4 billion of net charge-offs and a $149 million net reserve build. The CET1 Standardized ratio was 14.1%.
What did management say about the outlook?
The release gives no numeric guidance. Jamie Dimon called the U.S. economy resilient but warned of geopolitical tensions, sticky inflation, large global fiscal deficits and elevated asset prices.