
Intel (INTC) · Semiconductors
Intel Q2 2026 earnings: summary, key numbers & outlook
Results filed 23 Jul 2026 · Quarter ended 27 Jun 2026
Slides (16 pages)Press release ↗Investor relations ↗
Summaries and transcripts are machine-generated and can contain errors.
In brief
Second-quarter revenue was $16.1 billion, up 25% year-over-year (YoY); second-quarter earnings (loss) per share (EPS) attributable to Intel was $(2.16); non-GAAP EPS attributable to Intel was $0.42.
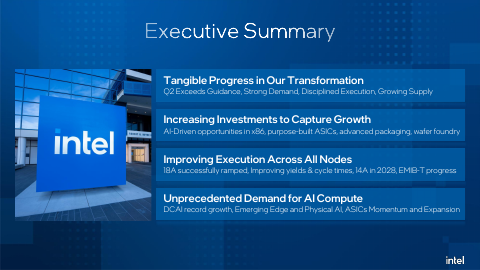
Intel's second-quarter revenue was $16.1 billion, up 25% from a year ago, which management called its strongest revenue growth in more than fifteen years. Data Center and AI revenue rose 59% to $6.3 billion, and Client Computing and Physical AI revenue rose 13%. Non-GAAP earnings per share were $0.42. The GAAP loss per share of $(2.16) was driven mainly by a non-cash charge tied to shares held in escrow for the U.S. government.
Intel forecasts third-quarter revenue of $15.8 billion to $16.8 billion, with non-GAAP EPS of $0.38. Management says AI-driven demand is strong and is raising spending on equipment, clean room space and substrates. The tension is cash: adjusted free cash flow was $(8.4) billion in the quarter, and Intel Foundry still lost money at the operating level, with an operating loss of $2,089 million. Industry-wide substrate and memory shortages are also a risk.
Slides & documents
Open the slide deck (PDF, 16 pages) ↗
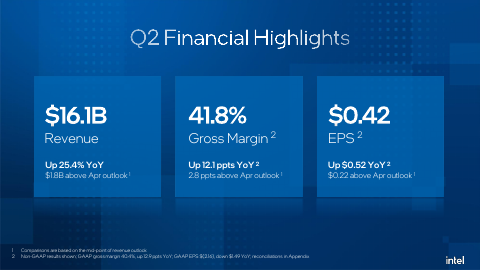
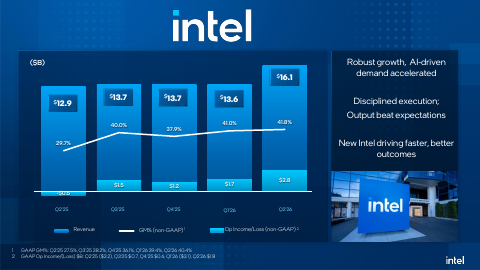
Showing the first 6 of 16 pages.
From Intel investor relations
SEC filing
Key numbers
- Revenue · GAAP
- $16.1 billion
- Net income (loss) attributable to Intel · GAAP
- -$11.0B
- Diluted EPS attributable to Intel · GAAP
- $(2.16)
- Non-GAAP diluted EPS attributable to Intel · non-GAAP
- $0.42
- Gross margin · GAAP
- 40.4%
- Non-GAAP gross margin · non-GAAP
- 41.8%
- Operating income · GAAP
- $1.8B
- Operating margin · GAAP
- 11.1%
up 25% year-over-year
vs. $(0.67) a year ago
vs. $(0.10) a year ago
up 12.9 ppts
up 12.1 ppts
up 35.8 ppts
| Segment or metric | Value | Change |
|---|---|---|
| Client Computing and Physical AI Group (CCPG) | $8.9 billion | up 13% |
| Data Center and AI (DCAI) | 6.3 billion | up 59% |
| Total Intel Products | 15.1 billion | up 28% |
| Intel Foundry | 5.8 billion | up 31% |
| All other | 0.7 billion | down 33% |
Where each number comes from
- Revenue: “Second-quarter revenue was $16.1 billion, up 25% year-over-year (YoY).”
- Net income (loss) attributable to Intel: “Less: net income (loss) attributable to non-controlling interests | 185 | (106) Net income (loss) attributable to Intel | $(11,033) | $(2,918)”
- Diluted EPS attributable to Intel: “Second-quarter earnings (loss) per share (EPS) attributable to Intel was $(2.16); non-GAAP EPS attributable to Intel was $0.42.”
- Non-GAAP diluted EPS attributable to Intel: “Second-quarter earnings (loss) per share (EPS) attributable to Intel was $(2.16); non-GAAP EPS attributable to Intel was $0.42.”
- Gross margin: “Gross margin | 40.4% | 27.5% | up 12.9 ppts | 41.8% | 29.7% | up 12.1 ppts”
- Non-GAAP gross margin: “Gross margin | 40.4% | 27.5% | up 12.9 ppts | 41.8% | 29.7% | up 12.1 ppts”
- Operating income: “Operating income (loss) | 1,796 | (3,176) Gains (losses) on equity investments, net | (39) | 502”
- Operating margin: “Operating margin (loss) | 11.1% | (24.7)% | up 35.8 ppts | 17.2% | (3.9)% | up 21.1 ppts”
- Client Computing and Physical AI Group (CCPG): “Client Computing and Physical AI Group (CCPG)2 | $8.9 billion | up | 13% Data Center and AI (DCAI) | 6.3 billion | up | 59%”
- Data Center and AI (DCAI): “Client Computing and Physical AI Group (CCPG)2 | $8.9 billion | up | 13% Data Center and AI (DCAI) | 6.3 billion | up | 59%”
- Total Intel Products: “Total Intel Products revenue | 15.1 billion | up | 28% Intel Foundry | 5.8 billion | up | 31% All other | 0.7 billion | down | 33%”
- Intel Foundry: “Total Intel Products revenue | 15.1 billion | up | 28% Intel Foundry | 5.8 billion | up | 31% All other | 0.7 billion | down | 33%”
- All other: “Total Intel Products revenue | 15.1 billion | up | 28% Intel Foundry | 5.8 billion | up | 31% All other | 0.7 billion | down | 33%”
Copied from the press release ↗ and other documents in the SEC filing ↗. A figure is published only if its sentence is in the filing.
| From the filing | Q2 2026 | vs year ago | vs last quarter |
|---|---|---|---|
| Revenue | $16.1B | +25.4% | +18.8% |
| Operating income | $1.8B | — | — |
| Net income | -$11.0B | −278.1% | −195.9% |
| Diluted EPS | -$2.16 | −222.4% | −195.9% |
| Free cash flow | $4.5B | — | — |
| Gross margin | 40.4% | +12.9 pts | +1.0 pts |
| Operating margin | 11.1% | +35.8 pts | +34.2 pts |
Calculated by code from XBRL, not by the model.
Outlook
| Metric | Period | Outlook |
|---|---|---|
| Revenue | third quarter of 2026 | $15.8-16.8 billion |
| GAAP gross margin | third quarter of 2026 | 41.0% |
| Non-GAAP gross margin | third quarter of 2026 | 42.0% |
| GAAP tax rate | third quarter of 2026 | 1% |
| Non-GAAP tax rate | third quarter of 2026 | 11% |
| GAAP diluted EPS attributable to Intel | third quarter of 2026 | $0.31 |
| Non-GAAP diluted EPS attributable to Intel | third quarter of 2026 | $0.38 |
| GAAP operating expenses | full-year 2026 | $23.0 |
| Non-GAAP operating expenses | full-year 2026 | $16.5 |
Key takeaways
Revenue grew 25%, fastest in fifteen-plus years
Second-quarter revenue was $16.1 billion, up 25% year-over-year. CEO Lip-Bu Tan called it Intel's strongest revenue growth in more than fifteen years.
Data center revenue jumped 59% on AI demand
Data Center and AI revenue was 6.3 billion, up 59%, while Client Computing and Physical AI was $8.9 billion, up 13%. DCAI operating income was $2,474 million versus $633 million a year ago.
GAAP loss reflects escrowed-share mark-to-market charge
GAAP EPS was $(2.16) while non-GAAP EPS was $0.42. The reconciliation shows a $2.45 per-share adjustment for (gains) losses on mark-to-market of Escrowed Shares.
Foundry still loses money despite 31% growth
Intel Foundry revenue was 5.8 billion, up 31%, but it posted an operating loss of $(2,089) million. Intel 18A-P entered risk production.
Heavy investment drives negative adjusted free cash flow
Adjusted free cash flow was $(8,419) million on $7.0 billion of operating cash flow. The CFO said Intel is meaningfully increasing investments in equipment, clean room space, and substrates.
Charts
Fourth quarter worked out from the annual figure.
Data
| Q4 2024 | $14.3B * |
| Q1 2025 | $12.7B |
| Q2 2025 | $12.9B |
| Q3 2025 | $13.7B |
| Q4 2025 | $13.7B * |
| Q1 2026 | $13.6B |
| Q2 2026 | $16.1B |
| Q3 2026 | $16.5B |
Data
| Q1 2025 | -$0.19 |
| Q2 2025 | -$0.67 |
| Q3 2025 | $0.90 |
| Q1 2026 | -$0.73 |
| Q2 2026 | -$2.16 |
| Q3 2026 | $0.60 |
Fourth-quarter EPS appears once the press release is read; filings report it only for the full year.
Data
| Q4 2024 | 2.9% |
| Q1 2025 | -2.4% |
| Q2 2025 | -24.7% |
| Q3 2025 | 5.0% |
| Q4 2025 | 4.2% |
| Q1 2026 | -23.1% |
| Q2 2026 | 11.1% |
| Q3 2026 | 15.3% |
Data
| Q4 2024 | -$2.7B |
| Q1 2025 | -$4.4B |
| Q2 2025 | -$1.5B |
| Q3 2025 | $121.0M |
| Q4 2025 | $800.0M |
| Q1 2026 | -$2.5B |
| Q2 2026 | $4.5B |
| Q3 2026 | $1.1B |
Operating cash flow minus capital expenditure, from cash flow statements.
Questions
What were Intel's Q2 2026 revenue and earnings?
Revenue was $16.1 billion, up 25% year-over-year. GAAP diluted EPS was $(2.16) and non-GAAP EPS was $0.42.
Why was Intel's GAAP EPS negative while non-GAAP EPS was positive?
The reconciliation shows a $2.45 per-share adjustment for (gains) losses on mark-to-market of Escrowed Shares, which Intel excludes from non-GAAP results. Smaller items include share-based compensation of $0.13 and restructuring of $0.03.
What is Intel's guidance for Q3 2026?
Intel expects revenue of $15.8 billion to $16.8 billion, non-GAAP gross margin of 42.0% and non-GAAP EPS of $0.38. GAAP EPS is expected to be $0.31.
How did Intel's business segments perform?
Data Center and AI revenue rose 59% to 6.3 billion and Client Computing and Physical AI rose 13% to $8.9 billion. Intel Foundry revenue rose 31% to 5.8 billion.
How is Intel's cash flow and spending?
Intel generated $7.0 billion in cash from operations in the quarter, but adjusted free cash flow was $(8,419) million. Management is increasing investment in equipment, clean room space and substrates.