
Hims & Hers (HIMS) · Health Care
Hims & Hers Q2 2026 earnings: summary, key numbers & outlook
Results filed 10 Aug 2026 · Quarter ended 30 Jun 2026
Slides (39 pages)Official transcript (PDF) ↗Press release ↗Investor relations ↗
Summaries and transcripts are machine-generated and can contain errors.
In brief
Hims & Hers reported second quarter 2026 revenue of approximately $753 million, up 38% year-over-year, with subscribers of nearly 2.9 million, up 19% year-over-year, and a net loss of $86.3 million.
Hims & Hers grew revenue 38% to $753.2 million in the second quarter, and subscribers rose 19% to 2,891 thousand. U.S. revenue grew 16%. Rest of the World revenue jumped from $7,547 thousand to $131,384 thousand after the Eucalyptus acquisition closed in June. Profits fell, though. Gross margin dropped to 64% from 76%, the company posted a net loss of $86.3 million, and Adjusted EBITDA declined to $60.3 million. Legal contingencies and acquisition costs added to expenses.
Management raised its full year 2026 revenue outlook to $3.1 billion to $3.3 billion. It expects third quarter revenue of $880 million to $900 million and says U.S. growth should keep accelerating in the second half. Adjusted EBITDA guidance is $275 million to $325 million for the year. The main tension is profitability. Margins are lower than a year ago, free cash flow was negative $68.2 million in the quarter, and the acquisition has added debt-like obligations and goodwill.
Slides & documents
Open the slide deck (PDF, 39 pages) ↗




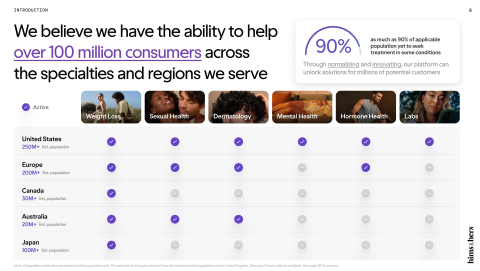
Showing the first 6 of 39 pages.
From Hims & Hers investor relations
SEC filing
Key numbers
- Revenue · GAAP
- $753.2 million
- Net loss · GAAP
- $86.3 million
- Diluted EPS · GAAP
- $(0.37)
- Gross margin · GAAP
- 64%
- Loss from operations · GAAP
- -$97.2M
- Net cash used in operating activities · GAAP
- $(35.9) million
- Free Cash Flow · non-GAAP
- $(68.2) million
- Adjusted EBITDA · non-GAAP
- $60.3 million
up 38% year-over-year
compared to net income of $42.5 million a year ago
compared to $0.17 a year ago
compared to 76% a year ago
compared to income of 26,723 a year ago
compared to $(19.1) million a year ago
compared to $(69.4) million a year ago
compared to $82.2 million a year ago
| Segment or metric | Value | Change |
|---|---|---|
| Subscribers (end of period, thousands) | $2.9M | 19% |
| Monthly Revenue per Average Subscriber | $92 | 21% |
| United States Revenue | $621.8M | 16% |
| Rest of the World Revenue | $131.4M | 1,641% |
Where each number comes from
- Revenue: “Revenue was $753.2 million for the second quarter of 2026 compared to $544.8 million for the second quarter of 2025, an increase of 38% year-over-year.”
- Net loss: “Net loss was $86.3 million for the second quarter of 2026 compared to net income of $42.5 million for the second quarter of 2025.”
- Diluted EPS: “Net (loss) income per share attributable to common stockholders: Basic | $(0.37) | $0.19 | $(0.78) | $0.41 Diluted | $(0.37) | $0.17 | $(0.78) | $0.37”
- Gross margin: “Gross margin was 64% for the second quarter of 2026 compared to 76% for the second quarter of 2025.”
- Loss from operations: “(Loss) income from operations | (97,192) | 26,723 | (175,515) | 84,620”
- Net cash used in operating activities: “Net cash (used in) operating activities was $(35.9) million for the second quarter of 2026 compared to $(19.1) million for the second quarter of 2025.”
- Free Cash Flow: “Free Cash Flow was $(68.2) million for the second quarter of 2026 compared to $(69.4) million for the second quarter of 2025.”
- Adjusted EBITDA: “Adjusted EBITDA was $60.3 million for the second quarter of 2026 compared to $82.2 million for the second quarter of 2025.”
- Subscribers (end of period, thousands): “Subscribers (end of period) | 2,891 | 2,439 | 19% | 2,891 | 2,439 | 19%”
- Monthly Revenue per Average Subscriber: “Monthly Revenue per Average Subscriber | $92 | $76 | 21% | $84 | $81 | 4%”
- United States Revenue: “United States Revenue | $621,830 | $537,286 | 16% | $1,151,739 | $1,115,978 | 3%”
- Rest of the World Revenue: “Rest of the World Revenue | 131,384 | 7,547 | 1,641% | 209,579 | 14,865 | 1,310%”
Copied from the press release ↗ and other documents in the SEC filing ↗. A figure is published only if its sentence is in the filing.
| From the filing | Q2 2026 | vs year ago | vs last quarter |
|---|---|---|---|
| Revenue | $753.2M | +38.2% | +23.9% |
| Operating income | -$97.2M | — | −24.1% |
| Net income | -$86.3M | — | +6.3% |
| Diluted EPS | -$0.37 | — | +7.5% |
| Free cash flow | -$68.2M | +1.8% | — |
| Gross margin | 63.8% | −12.6 pts | −1.4 pts |
| Operating margin | -12.9% | −17.8 pts | +0.0 pts |
Calculated by code from XBRL, not by the model.
Outlook
| Metric | Period | Outlook |
|---|---|---|
| Revenue | third quarter 2026 | $880 million to $900 million |
| Adjusted EBITDA | third quarter 2026 | $75 million to $95 million |
| Adjusted EBITDA margin | third quarter 2026 | 9% to 11% |
| Revenue | full year 2026 | $3.1 billion to $3.3 billion |
| Adjusted EBITDA | full year 2026 | $275 million to $325 million |
| Adjusted EBITDA margin | full year 2026 | 9% to 10% |
| 2030 revenue target | 2030 | at least $6.5 billion |
| 2030 Adjusted EBITDA target | 2030 | $1.3 billion |
Key takeaways
Revenue grew 38% on international expansion
Revenue was $753.2 million versus $544.8 million a year ago, with Rest of the World revenue of $131,384 thousand versus $7,547 thousand after the Eucalyptus acquisition closed in June.
U.S. growth re-accelerated to 16%
United States Revenue rose 16% to $621,830 thousand, compared with 3% growth for the six months ended June 30, 2026. Management expects the domestic business to keep accelerating through the second half.
Gross margin fell to 64% from 76%
Cost of revenue rose to $272,411 thousand from $128,637 thousand, outpacing revenue growth and squeezing gross profit margin year over year.
Net loss of $86.3 million after legal charges
The quarter included $47,500 thousand of legal contingencies and $28,835 thousand of acquisition and transaction-related costs. Adjusted EBITDA was $60.3 million versus $82.2 million.
Full-year revenue guidance raised to $3.1-$3.3 billion
Third quarter revenue is guided to $880 million to $900 million, and full year Adjusted EBITDA is guided to $275 million to $325 million, a 9% to 10% margin.
Charts
Fourth quarter worked out from the annual figure.
Data
| Q4 2024 | $481.1M * |
| Q1 2025 | $586.0M |
| Q2 2025 | $544.8M |
| Q3 2025 | $599.0M |
| Q4 2025 | $617.8M * |
| Q1 2026 | $608.1M |
| Q2 2026 | $753.2M |
| Q3 2026 | $890.4M |
Data
| Q1 2025 | $0.20 |
| Q2 2025 | $0.17 |
| Q3 2025 | $0.06 |
| Q1 2026 | -$0.40 |
| Q2 2026 | -$0.37 |
| Q3 2026 | -$0.14 |
Fourth-quarter EPS appears once the press release is read; filings report it only for the full year.
Data
| Q4 2024 | 3.9% |
| Q1 2025 | 9.9% |
| Q2 2025 | 4.9% |
| Q3 2025 | 2.0% |
| Q4 2025 | 1.5% |
| Q1 2026 | -12.9% |
| Q2 2026 | -12.9% |
| Q3 2026 | -7.4% |
Data
| Q4 2024 | $59.5M |
| Q1 2025 | $50.1M |
| Q2 2025 | -$69.5M |
| Q3 2025 | $79.4M |
| Q4 2025 | -$2.6M |
| Q1 2026 | $53.1M |
| Q2 2026 | -$68.2M |
| Q3 2026 | $26.0M |
Operating cash flow minus capital expenditure, from cash flow statements.
Questions
What were Hims & Hers' second quarter 2026 revenue and growth?
Revenue was $753.2 million, up 38% from $544.8 million a year ago. U.S. revenue grew 16% and Rest of the World revenue rose to $131,384 thousand from $7,547 thousand.
Was Hims & Hers profitable in the quarter?
No. It reported a net loss of $86.3 million, or $(0.37) per diluted share, versus net income of $42.5 million a year ago. Non-GAAP Adjusted EBITDA was still positive at $60.3 million.
What is the company's guidance for the third quarter and full year 2026?
For the third quarter it expects revenue of $880 million to $900 million and Adjusted EBITDA of $75 million to $95 million. For 2026 it expects revenue of $3.1 billion to $3.3 billion and Adjusted EBITDA of $275 million to $325 million.
Why did gross margin decline?
Gross margin fell to 64% from 76% a year ago as cost of revenue rose to $272,411 thousand from $128,637 thousand. The release does not give a detailed breakdown of the drivers.
How many subscribers does Hims & Hers have and what is its cash position?
Subscribers reached 2,891 thousand, up 19%, and Monthly Revenue per Average Subscriber was $92. Cash and cash equivalents were $609,811 thousand at June 30, 2026, and Free Cash Flow for the quarter was $(68.2) million.