
Alphabet (GOOGL) · Internet & Advertising
Alphabet Q2 2026 earnings: summary, key numbers & outlook
Results filed 22 Jul 2026 · Quarter ended 30 Jun 2026
Slides (12 pages)Official transcript (PDF) ↗Press release ↗Investor relations ↗
Summaries and transcripts are machine-generated and can contain errors.
In brief
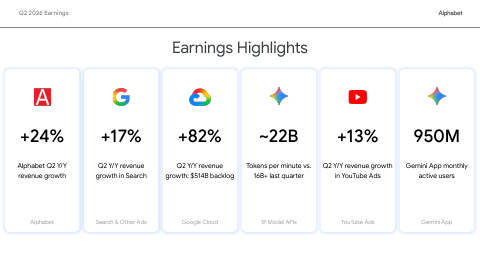
Alphabet's second quarter 2026 revenues increased 24% to $119.8 billion, Google Cloud revenues increased 82% to $24.8 billion, and diluted EPS was $9.11.
Alphabet's revenue rose 24% to $119.8 billion, its 12th consecutive quarter of double-digit growth. Google Cloud was the standout: revenue grew 82% to $24.8 billion and its operating income rose to $8,814 million from $2,826 million. Google Services grew 15% to $94.5 billion, led by Search & other, up 17%. Operating margin reached 34%. Net income was lifted by a $98.0 billion other-income gain, mostly unrealized gains on equity securities, so EPS of $9.11 overstates underlying earnings.
The release gave no numerical guidance for future periods. The visible tension is spending: purchases of property and equipment were $44,924 million, more than operating cash flow of $39,069 million, so free cash flow was negative at $(5,855) million. Alphabet funded this with a $49.6 billion equity raise and $20.3 billion of senior notes, and long-term debt rose to $98,165 million. Its main bet is that AI demand keeps Cloud and Search growing fast enough to justify the investment.
Slides & documents
Open the slide deck (PDF, 12 pages) ↗
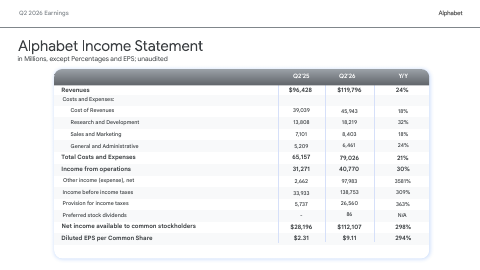
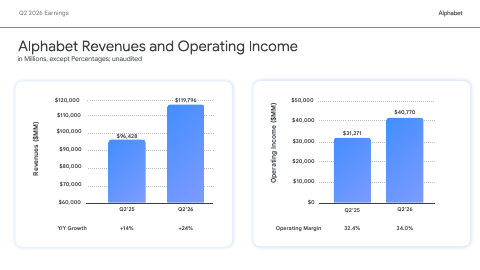
Showing the first 6 of 12 pages.
From Alphabet investor relations
SEC filing
Key numbers
- Total revenues · GAAP
- $119.8 billion
- Operating income · GAAP
- $40.8B
- Operating margin · GAAP
- 34%
- Net income available to common stockholders · GAAP
- $112.1B
- Diluted net income per common share · GAAP
- $9.11
- Net cash provided by operating activities · GAAP
- $39.1B
- Free cash flow · non-GAAP
- -$5.9B
- Purchases of property and equipment (capital expenditures) · GAAP
- -$44.9B
up 24% from a year ago (23% in constant currency)
up 30% from a year ago
up 2 percentage points from a year ago
up 298% from a year ago
up 294% from a year ago
| Segment or metric | Value | Change |
|---|---|---|
| Google Cloud revenues | $24.8 billion | up 82% |
| Google Services revenues | $94.5 billion | up 15% |
| Google Search & other revenues | $63,271 | up 17% |
| YouTube ads revenues | $11,055 | up 13% |
| Google Cloud operating income | $8,814 | |
| Gemini App monthly active users | 950 million |
Where each number comes from
- Total revenues: “Consolidated Alphabet revenues increased 24%, or 23% in constant currency, to $119.8 billion, reflecting strong performance across the business and our 12th consecutive quarter of double-digit revenue growth.”
- Operating income: “Change in constant currency revenues year over year(1) | 13% | 23% Operating income | $31,271 | $40,770 Operating margin | 32% | 34% Other income (expense), net | $2,662 | $97,983”
- Operating margin: “Consolidated Alphabet operating income increased 30% and operating margin expanded by 2 percentage points to 34%.”
- Net income available to common stockholders: “Operating income | $31,271 | $40,770 Operating margin | 32% | 34% Other income (expense), net | $2,662 | $97,983 Net income available to common stockholders | $28,196 | $112,107”
- Diluted net income per common share: “Net income available to common stockholders increased 298% and EPS increased 294% to $9.11.”
- Net cash provided by operating activities: “Net cash provided by operating activities | $48,414 | $52,402 | $45,790 | $39,069 | $185,675 Less: purchases of property and equipment | (23,953)”
- Free cash flow: “Free cash flow | $24,461 | $24,551 | $10,116 | $(5,855) | $53,273 Free cash flow: We define free cash flow as net cash provided by operating activities less capital expenditures.”
- Purchases of property and equipment (capital expenditures): “Less: purchases of property and equipment | (23,953) | (27,851) | (35,674) | (44,924) | (132,402) Free cash flow | $24,461 | $24,551 | $10,116”
- Google Cloud revenues: “Google Cloud saw a meaningful acceleration in growth as revenues increased 82% to $24.8 billion, led by an increase in Google Cloud Platform (GCP) across enterprise AI Solutions”
- Google Services revenues: “Google Services revenues increased 15% to $94.5 billion, led by 17% growth in Google Search & other, 15% in Google subscriptions, platforms, and devices, and 13% in YouTube ads.”
- Google Search & other revenues: “Google Search & other | $54,190 | $63,271 YouTube ads | 9,796 | 11,055 Google Network | 7,354 | 7,303 Google advertising | 71,340 | 81,629”
- YouTube ads revenues: “Google Search & other | $54,190 | $63,271 YouTube ads | 9,796 | 11,055 Google Network | 7,354 | 7,303 Google advertising | 71,340 | 81,629”
- Google Cloud operating income: “Google Services | $33,063 | $39,544 Google Cloud | 2,826 | 8,814 Other Bets | (1,246) | (1,799) Alphabet-level activities(1) | (3,372) | (5,789)”
- Gemini App monthly active users: “Gemini models now process 22 billion API tokens per minute and the Gemini App has 950 million monthly active users.”
Copied from the press release ↗ and other documents in the SEC filing ↗. A figure is published only if its sentence is in the filing.
| From the filing | Q2 2026 | vs year ago | vs last quarter |
|---|---|---|---|
| Revenue | $119.8B | +24.2% | +9.0% |
| Operating income | $40.8B | +30.4% | +2.7% |
| Net income | $112.2B | +297.9% | +79.3% |
| Diluted EPS | $9.11 | +294.4% | +78.3% |
| Free cash flow | -$5.9B | — | — |
| Operating margin | 34.0% | +1.6 pts | −2.1 pts |
Calculated by code from XBRL, not by the model.
Key takeaways
Google Cloud revenue growth accelerated to 82%
Google Cloud revenues increased 82% to $24.8 billion, and its operating income rose to $8,814 million from $2,826 million a year earlier.
Search still growing double digits
Google Search & other grew 17% to $63,271 million, and Google Services revenues increased 15% to $94.5 billion.
Net income inflated by equity gains
Other income was a net gain of $98.0 billion, mostly unrealized gains on equity securities. The gain on equity securities of $99.0 billion added $6.26 to diluted EPS of $9.11.
Capex outran operating cash flow
Purchases of property and equipment were $44,924 million against operating cash flow of $39,069 million, leaving free cash flow of $(5,855) million for the quarter.
Alphabet raised heavy outside capital
In June 2026 it raised $49.6 billion of net proceeds from stock and mandatory convertible preferred, plus $20.3 billion from senior unsecured notes. Long-term debt was $98,165 million at June 30, 2026.
Charts
Fourth quarter worked out from the annual figure.
Data
| Q4 2024 | $96.5B * |
| Q1 2025 | $90.2B |
| Q2 2025 | $96.4B |
| Q3 2025 | $102.3B |
| Q4 2025 | $113.8B * |
| Q1 2026 | $109.9B |
| Q2 2026 | $119.8B |
| Q3 2026 | $127.6B |
Data
| Q1 2025 | $2.81 |
| Q2 2025 | $2.31 |
| Q3 2025 | $2.87 |
| Q1 2026 | $5.11 |
| Q2 2026 | $9.11 |
| Q3 2026 | $2.12 |
Fourth-quarter EPS appears once the press release is read; filings report it only for the full year.
Data
| Q4 2024 | 32.1% |
| Q1 2025 | 33.9% |
| Q2 2025 | 32.4% |
| Q3 2025 | 30.5% |
| Q4 2025 | 31.6% |
| Q1 2026 | 36.1% |
| Q2 2026 | 34.0% |
| Q3 2026 | 31.8% |
Data
| Q4 2024 | $24.8B |
| Q1 2025 | $19.0B |
| Q2 2025 | $5.3B |
| Q3 2025 | $24.5B |
| Q4 2025 | $24.6B |
| Q1 2026 | $10.1B |
| Q2 2026 | -$5.9B |
| Q3 2026 | -$9.1B |
Operating cash flow minus capital expenditure, from cash flow statements.
Questions
What were Alphabet's Q2 2026 revenue and EPS?
Revenues were $119.8 billion, up 24% (23% in constant currency), and diluted EPS was $9.11, up 294% from a year ago. The EPS figure includes a large gain on equity securities.
How did Google Cloud perform in Q2 2026?
Google Cloud revenues rose 82% to $24.8 billion, and operating income was $8,814 million versus $2,826 million a year ago. Growth came from enterprise AI Solutions, enterprise AI Infrastructure and core GCP services.
Why was net income so high compared with operating income?
Other income was a net gain of $98.0 billion, mainly net unrealized gains on equity securities. The equity gain added $77.1 billion to net income and $6.26 to diluted EPS.
Did Alphabet generate free cash flow in Q2 2026?
No. Free cash flow was $(5,855) million, because purchases of property and equipment of $44,924 million exceeded operating cash flow of $39,069 million. Trailing twelve-month free cash flow was still $53,273 million.
Did Alphabet give financial guidance for next quarter or the year?
The earnings release contains no numerical guidance, and no call transcript was provided. It says the June 2026 equity raise will fund capital expenditures to scale AI infrastructure and global compute.