
FedEx (FDX) · Transportation
FedEx Q3 2026 earnings: summary, key numbers & outlook
Results filed 28 Oct 2026 · Quarter ended 30 Sep 2026
Slides (16 pages)Official transcript (PDF) ↗Press release ↗Investor relations ↗
Summaries and transcripts are machine-generated and can contain errors.
In brief
FedEx reported third-quarter revenue of $22.9 billion, diluted EPS of $1.21 and adjusted diluted EPS of $3.74, and raised its calendar 2026 earnings outlook.
FedEx grew revenue 12% to $22.9 billion in the quarter ended September 30, 2026. Higher package prices and volumes, plus cost savings from its transformation program, lifted operating income to $1.07 billion. GAAP diluted EPS was $1.21, held down by a $1.2 billion loss on the 19.9% stake kept in FedEx Freight after the spin-off. Adjusted EPS was $3.74, which excludes that loss and a gain on retiring debt. FedEx also repurchased $2.0 billion of stock.
FedEx raised its calendar 2026 adjusted EPS outlook to $18.00 to $18.60 and expects revenue growth of about 12%. Parcel rates rise an average of 5.9% on January 4, 2027. The main tension is cost: purchased transportation, wages and fuel are rising faster than revenue, and global trade policy continues to weigh. International package volume fell 4%, and $2.7 billion of tariff refunds held for customers inflates the cash balance.
Slides & documents
Open the slide deck (PDF, 16 pages) ↗


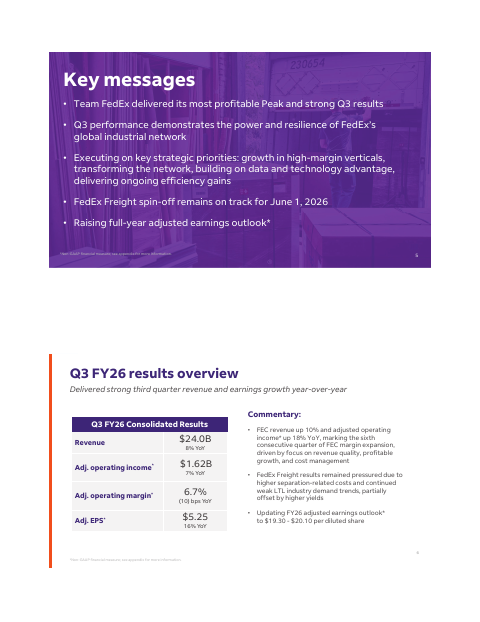
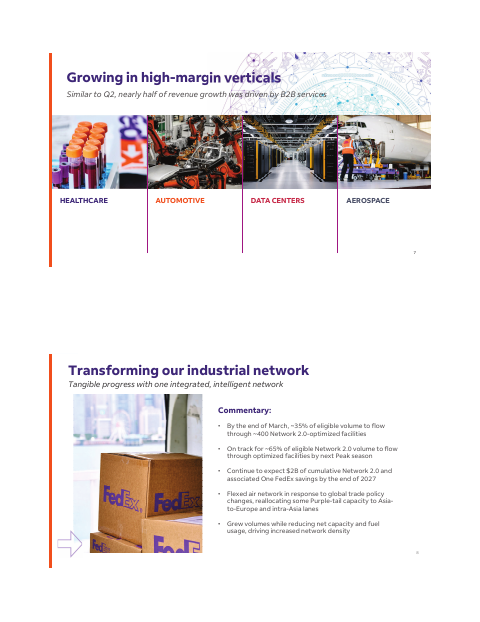

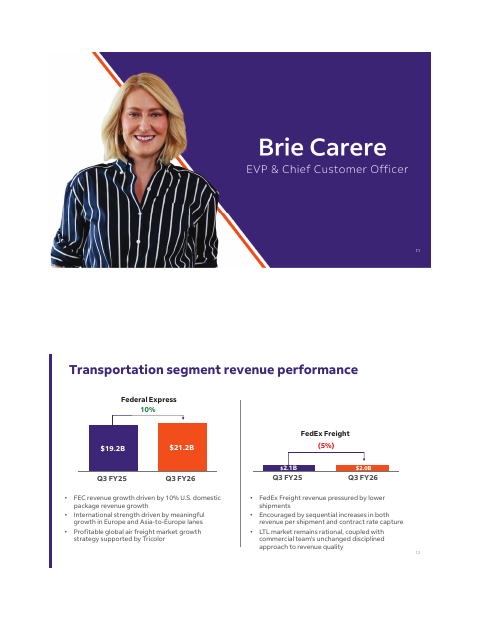
Showing the first 6 of 16 pages.
From FedEx investor relations
- TranscriptCompany's official transcript ↗
- WebcastWebcast replay ↗
- 10-QDocument ↗
- PodcastDocument ↗
- Stat BookDocument ↗
- Stat BookDocument ↗
SEC filing
Key numbers
- Revenue · GAAP
- $22.9 billion
- Operating income · GAAP
- $1.07 billion
- Operating margin · GAAP
- 4.7%
- Net income (continuing operations) · GAAP
- $0.29 billion
- Diluted EPS (continuing operations) · GAAP
- $1.21
- Adjusted diluted EPS (continuing operations) · non-GAAP
- $3.74
- Cash provided by operating activities (nine months) · GAAP
- $7.4B
up 12% from a year ago
up 10% from a year ago
vs 4.8% a year ago
vs $0.65 billion a year ago
vs $2.73 a year ago
vs $2.93 a year ago
vs 6,638 in the prior-year nine months
| Segment or metric | Value | Change |
|---|---|---|
| Express U.S. Domestic revenue | $14.7B | up 10% |
| Express International revenue | $7.5B | up 17% |
| Express U.S. Domestic operating income | $946.0M | up 7% |
| Express International operating income | $220.0M | up 15% |
| U.S. domestic composite package yield | $15.32 | up 7% |
| Total U.S. domestic average daily package volume | $14.4M | up 2% |
| International composite package yield | $30.46 | up 17% |
| Total International average daily package volume | $2.8M | down 4% |
Where each number comes from
- Revenue: “Revenue | $22.9 billion | $22.9 billion | $20.4 billion | $20.4 billion Operating income | $1.07 billion | $1.20 billion”
- Operating income: “Operating income | $1.07 billion | $1.20 billion | $0.97 billion | $1.03 billion Operating margin | 4.7% | 5.3% | 4.8% | 5.1%”
- Operating margin: “Operating income | $1.07 billion | $1.20 billion | $0.97 billion | $1.03 billion Operating margin | 4.7% | 5.3% | 4.8% | 5.1%”
- Net income (continuing operations): “Net income | $0.29 billion | $0.90 billion | $0.65 billion | $0.69 billion Diluted EPS | $1.21 | $3.74 | $2.73 | $2.93”
- Diluted EPS (continuing operations): “Net income | $0.29 billion | $0.90 billion | $0.65 billion | $0.69 billion Diluted EPS | $1.21 | $3.74 | $2.73 | $2.93”
- Adjusted diluted EPS (continuing operations): “Net income | $0.29 billion | $0.90 billion | $0.65 billion | $0.69 billion Diluted EPS | $1.21 | $3.74 | $2.73 | $2.93”
- Cash provided by operating activities (nine months): “Changes in operating assets and liabilities, net | (1,213) | (2,091) Cash provided by operating activities | 7,448 | 6,638”
- Express U.S. Domestic revenue: “Revenue: Express U.S. Domestic segment | $14,710 | $13,392 | 10 | $43,190 | $38,636 | 12 Express International segment | 7,465 | 6,363 | 17”
- Express International revenue: “Revenue: Express U.S. Domestic segment | $14,710 | $13,392 | 10 | $43,190 | $38,636 | 12 Express International segment | 7,465 | 6,363 | 17”
- Express U.S. Domestic operating income: “Total operating expenses | 13,764 | 12,508 | 10 | 39,985 | 35,990 | 11 Operating income | $946 | $884 | 7 | $3,205 | $2,646 | 21”
- Express International operating income: “Total operating expenses | 7,245 | 6,171 | 17 | 20,924 | 18,183 | 15 Operating income | $220 | $192 | 15 | $447 | $326 | 37”
- U.S. domestic composite package yield: “U.S. domestic composite | $15.32 | $14.28 | 7 | $15.34 | $14.25 | 8 FREIGHT STATISTICS Average daily freight pounds”
- Total U.S. domestic average daily package volume: “Total U.S. domestic ADV | 14,370 | 14,094 | 2 | 14,137 | 13,698 | 3 Revenue per package (yield): U.S. priority”
- International composite package yield: “Composite package yield | $30.46 | $25.96 | 17 | $29.39 | $25.21 | 17 FREIGHT STATISTICS Average daily freight pounds”
- Total International average daily package volume: “Total International ADV | 2,828 | 2,947 | (4) | 2,844 | 2,941 | (3) Revenue per package (yield): International priority”
Copied from the press release ↗ and other documents in the SEC filing ↗. A figure is published only if its sentence is in the filing.
| From the filing | Q3 2026 | vs year ago | vs last quarter |
|---|---|---|---|
| Revenue | $22.9B | +3.1% | −2.6% |
| Operating income | $1.1B | −17.4% | −22.6% |
| Net income | $290.0M | −68.1% | −69.7% |
| Diluted EPS | $1.21 | −67.8% | −70.0% |
| Free cash flow | $1.0B | +2.3% | — |
| Operating margin | 4.7% | −1.1 pts | −1.2 pts |
Calculated by code from XBRL, not by the model.
Outlook
| Metric | Period | Outlook |
|---|---|---|
| Revenue growth | calendar year 2026 | ~12% YoY |
| Diluted EPS (continuing operations, GAAP) | calendar year 2026 | $35.30 to $35.90 |
| Adjusted diluted EPS (continuing operations) | calendar year 2026 | $18.00 to $18.60 |
| Effective tax rate | calendar year 2026 | ~22.5% |
| Capital spending | calendar year 2026 | $3.9 billion |
| Pension contributions | calendar year 2026 | $475 million |
| Average parcel shipping rate increase | effective January 4, 2027 | 5.9% |
Key takeaways
Revenue grew 12% on higher yields
Revenue was $22.9 billion, up from $20.4 billion. U.S. domestic composite yield rose 7% and International composite package yield rose 17%.
GAAP EPS is far below adjusted EPS
Diluted EPS was $1.21 versus adjusted $3.74. The gap comes mainly from a $1.2 billion loss on the retained FedEx Freight stake, partly offset by a gain on extinguishment of debt.
Outlook raised for calendar 2026
Adjusted diluted EPS is now forecast at $18.00 to $18.60, up from $16.90 to $18.10. Revenue growth is now about 12%, from about 11%, and the tax rate is about 22.5%.
Costs are rising faster than revenue
Purchased transportation rose 19% and fuel rose 64%. U.S. Domestic operating margin slipped to 6.4% from 6.6%.
Portfolio reshaped and capital returned
FedEx completed the FedEx Freight spin-off on June 1, 2026 and sold FedEx Supply Chain for approximately $1.4 billion. It repurchased $2.0 billion of stock, with $4.3 billion remaining under authorization.
Charts
Fourth quarter worked out from the annual figure.
Data
| Q1 FY25 | $21.6B |
| Q2 FY25 | $22.0B |
| Q3 FY25 | $22.2B |
| Q4 FY25 | $22.2B * |
| Q1 FY26 | $22.2B |
| Q2 FY26 | $23.5B |
| Q3 FY26 | $22.9B |
| Q4 FY26 | $25.0B * |
Data
| Q1 FY25 | $3.21 |
| Q2 FY25 | $3.03 |
| Q3 FY25 | $3.76 |
| Q1 FY26 | $3.46 |
| Q2 FY26 | $4.04 |
| Q3 FY26 | $1.21 |
Fourth-quarter EPS appears once the press release is read; filings report it only for the full year.
Data
| Q1 FY25 | 5.0% |
| Q2 FY25 | 4.8% |
| Q3 FY25 | 5.8% |
| Q4 FY25 | 8.1% |
| Q1 FY26 | 5.3% |
| Q2 FY26 | 5.9% |
| Q3 FY26 | 4.7% |
| Q4 FY26 | 6.2% |
Data
| Q1 FY25 | $420.0M |
| Q2 FY25 | $500.0M |
| Q3 FY25 | $1.0B |
| Q4 FY25 | $1.0B |
| Q1 FY26 | $1.1B |
| Q3 FY26 | $1.0B |
| Q4 FY26 | $1.8B |
Operating cash flow minus capital expenditure, from cash flow statements.
Questions
What were FedEx's headline results for the quarter ended September 30, 2026?
Revenue was $22.9 billion, up 12%, with GAAP operating income of $1.07 billion and GAAP diluted EPS of $1.21. Adjusted diluted EPS was $3.74 versus $2.93 a year earlier.
Why is GAAP EPS so much lower than adjusted EPS?
GAAP results include a $1.2 billion loss on the 19.9% FedEx Freight stake, worth $5.18 per share. Adjusted results exclude it, along with a $1.97 per-share gain on extinguishment of debt and $0.68 per share of restructuring items.
What is FedEx's updated outlook?
For calendar 2026, FedEx expects adjusted diluted EPS of $18.00 to $18.60, revenue growth of about 12%, a tax rate of about 22.5%, and capital spending of $3.9 billion. Adjusted EPS guidance was previously $16.90 to $18.10.
How did the two Express segments perform?
Express U.S. Domestic revenue rose 10% to $14,710 million and operating income rose 7% to $946 million. Express International revenue rose 17% to $7,465 million and operating income rose 15% to $220 million, though International package volume fell 4%.
What did FedEx do with its capital and portfolio?
FedEx completed $2.0 billion of share repurchases, and $4.3 billion remains authorized. It also completed the FedEx Freight spin-off and sold FedEx Supply Chain to CMA CGM Group for approximately $1.4 billion on October 1, 2026.