
CoreWeave (CRWV) · Software
CoreWeave Q1 2026 earnings: summary, key numbers & outlook
Results filed 7 May 2026 · Quarter ended 31 Mar 2026
Slides (23 pages)Official transcript (PDF) ↗Press release ↗Investor relations ↗
Summaries and transcripts are machine-generated and can contain errors.
In brief
CoreWeave reported first quarter 2026 revenue of $2,078 million, a net loss of $(740) million and revenue backlog of $99.4 billion.
CoreWeave's revenue was $2,078 million in the first quarter of 2026, up 112% from a year ago. The company posted an operating loss of $(144) million and a net loss of $(740) million. Interest expense, net was $(536) million. Revenue backlog, meaning contracted future revenue, reached $99.4 billion, up 284%. Active power passed 1 GW and contracted power rose to over 3.5 GW. The company says it signed a new $21 billion Meta commitment and a multi-year Anthropic agreement.
The press release gave no numeric guidance. CoreWeave said it would give forward-looking guidance on its earnings call, and no call transcript was available here. The tension is that growth is costly. Adjusted operating margin fell to 1% from 17% a year ago, as deployment costs arrive before revenue ramps. Capital expenditures were $6.8 billion and interest costs are rising. Management points to $8.5 billion of new investment grade debt financing and a $2 billion NVIDIA equity investment.
Slides & documents
Open the slide deck (PDF, 23 pages) ↗


Showing the first 6 of 23 pages.
From CoreWeave investor relations
- Q2 and FY 2026 Outlook PresentationSlide deck ↗
- TranscriptCompany's official transcript ↗
- WebcastWebcast replay ↗
- Quarterly FilingDocument ↗
- Q1'26 Earnings InfographicDocument ↗
SEC filing
Key numbers
- Revenue · GAAP
- $2.1B
- Net loss · GAAP
- -$740.0M
- Diluted net loss per share · GAAP
- $(1.40)
- Operating loss · GAAP
- -$144.0M
- Operating loss margin · GAAP
- (7)%
- Net cash provided by operating activities · GAAP
- $3.0B
- Adjusted EBITDA · non-GAAP
- $1.2B
- Adjusted operating income · non-GAAP
- $21.0M
up 112% from a year ago
compared with $(315) million a year ago
compared with $(1.49) a year ago
compared with $(27) million a year ago
compared with (3)% a year ago
compared with 61 a year ago
compared with $606 million a year ago
compared with $163 million a year ago
| Segment or metric | Value | Change |
|---|---|---|
| Revenue backlog | $99.4 billion | up 284% year over year |
| Active power | 1 GW | surpassed 1 GW |
| Contracted power | over 3.5 GW | expanded by more than 400 MW |
| Capital expenditures | $6.8 billion | |
| New Meta commitment | $21 billion | signed in March |
Where each number comes from
- Revenue: “Three Months Ended March 31, 2026 | 2025 Revenue | $2,078 | $982 Operating expenses | 2,222 | 1,009 Operating loss | $(144) | $(27)”
- Net loss: “Interest expense, net | $(536) | $(264) Net loss | $(740) | $(315) Net loss margin | (36)% | (32)% Basic net loss per share”
- Diluted net loss per share: “Net loss margin | (36)% | (32)% Basic net loss per share | $(1.40) | $(1.40) Diluted net loss per share | $(1.40) | $(1.49)”
- Operating loss: “Three Months Ended March 31, 2026 | 2025 Revenue | $2,078 | $982 Operating expenses | 2,222 | 1,009 Operating loss | $(144) | $(27)”
- Operating loss margin: “Operating loss | $(144) | $(27) Operating loss margin | (7)% | (3)% Interest expense, net | $(536) | $(264)”
- Net cash provided by operating activities: “Deferred revenue | 575 | (16) Lease liabilities | (90) | (51) Net cash provided by operating activities | 2,984 | 61 Cash flows from investing activities:”
- Adjusted EBITDA: “Non-GAAP Financial Measures (In millions, except percentages) | Three Months Ended March 31, 2026 | 2025 Adjusted EBITDA | $1,157 | $606 Adjusted EBITDA margin | 56% | 62%”
- Adjusted operating income: “Adjusted EBITDA margin | 56% | 62% Adjusted operating income | $21 | $163 Adjusted operating income margin | 1% | 17% Adjusted net loss | $(589) | $(150)”
- Revenue backlog: “Additional First Quarter 2026 Financial Highlights Revenue backlog1 was $99.4 billion as of March 31, 2026.”
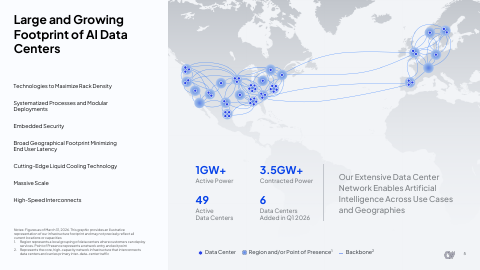
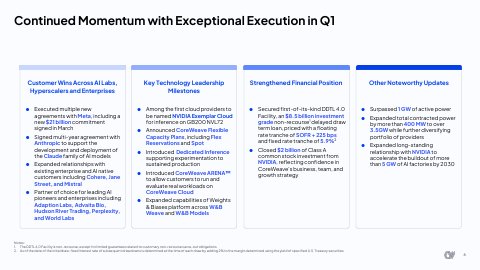
- Active power: “Surpassed 1 GW of active power ◦Expanded total contracted power by more than 400 MW to over 3.5 GW while further diversifying portfolio of providers”
- Contracted power: “Surpassed 1 GW of active power ◦Expanded total contracted power by more than 400 MW to over 3.5 GW while further diversifying portfolio of providers”
- Capital expenditures: “Capital Expenditures: $6.8 billion driven by the continued scaling of our platform to meet customer demand”
- New Meta commitment: “Executed multiple new agreements with Meta, including a new $21 billion commitment signed in March”
Copied from the press release ↗ and other documents in the SEC filing ↗. A figure is published only if its sentence is in the filing.
| From the filing | Q1 2026 | vs year ago | vs last quarter |
|---|---|---|---|
| Revenue | $2.1B | +111.6% | +32.2% |
| Operating income | -$144.0M | −433.3% | −60.7% |
| Net income | -$740.0M | −134.9% | −63.8% |
| Diluted EPS | -$1.40 | +6.0% | — |
| Free cash flow | -$4.7B | −250.0% | −88.4% |
| Operating margin | -6.9% | −4.2 pts | −1.2 pts |
Calculated by code from XBRL, not by the model.
Key takeaways
Backlog reached $99.4 billion, up 284%
Revenue backlog was $99.4 billion as of March 31, 2026, versus $25.9 billion a year earlier. The release calls it the strongest bookings quarter in CoreWeave's history.
Revenue more than doubled to $2,078 million
Revenue was $2,078 million versus $982 million a year ago, up 112%. Slide figures show sequential growth from $1,572 million in Q4'25.
Losses widened as costs outran revenue
Net loss was $(740) million versus $(315) million a year ago, and operating loss was $(144) million versus $(27) million. Interest expense, net rose to $(536) million.
Adjusted operating margin fell to 1%
Adjusted operating income was $21 million, or 1% margin, versus 17% a year ago. CoreWeave attributes the drop to deployment-related expenses incurred before revenue fully ramps.
Heavy investment funded by debt and NVIDIA equity
Capital expenditures were $6.8 billion, and the company secured an $8.5 billion DDTL 4.0 facility and closed a $2 billion Class A common stock investment from NVIDIA. Debt, non-current rose to $17,312 million from $14,665 million.
Charts
Fourth quarter worked out from the annual figure.
Data
| Q3 2024 | $583.9M |
| Q4 2024 | $747.0M * |
| Q1 2025 | $982.0M |
| Q2 2025 | $1.2B |
| Q3 2025 | $1.4B |
| Q4 2025 | $1.6B * |
| Q1 2026 | $2.1B |
| Q2 2026 | $2.6B |
Data
| Q3 2024 | -$1.82 |
| Q1 2025 | -$1.49 |
| Q2 2025 | -$0.60 |
| Q3 2025 | -$0.22 |
| Q1 2026 | -$1.40 |
| Q2 2026 | -$1.14 |
Fourth-quarter EPS appears once the press release is read; filings report it only for the full year.
Data
| Q3 2024 | 20.1% |
| Q4 2024 | 15.0% |
| Q1 2025 | -2.7% |
| Q2 2025 | 1.6% |
| Q3 2025 | 3.8% |
| Q4 2025 | -5.7% |
| Q1 2026 | -6.9% |
| Q2 2026 | -1.9% |
Data
| Q3 2024 | -$573.9M |
| Q4 2024 | -$3.3B |
| Q1 2025 | -$1.3B |
| Q2 2025 | -$2.7B |
| Q3 2025 | -$700.2M |
| Q4 2025 | -$2.5B |
| Q1 2026 | -$4.7B |
| Q2 2026 | -$5.7B |
Operating cash flow minus capital expenditure, from cash flow statements.
Questions
What did CoreWeave report for Q1 2026 revenue?
Revenue was $2,078 million, up 112% from $982 million in the first quarter of 2025. The company posted a net loss of $(740) million.
How large is CoreWeave's revenue backlog?
Revenue backlog was $99.4 billion as of March 31, 2026, up 284% from $25.9 billion a year earlier. It includes a new $21 billion commitment from Meta signed in March.
Is CoreWeave profitable?
No on a GAAP basis: the operating loss was $(144) million and the net loss was $(740) million, or $(1.40) per diluted share. Adjusted EBITDA was $1,157 million, a 56% margin, but that excludes depreciation and interest.
Did CoreWeave give financial guidance?
The press release gave no numbers and said guidance would be provided on the earnings call. No call transcript was available, so no guidance figures are included here.
How is CoreWeave financing its expansion?
It secured an $8.5 billion investment grade, non-recourse delayed draw term loan facility (DDTL 4.0) and closed a $2 billion Class A common stock investment from NVIDIA. Capital expenditures were $6.8 billion in the quarter.