
Coinbase (COIN) · Financial Technology
Coinbase Q2 2026 earnings: summary, key numbers & outlook
Results filed 30 Jul 2026 · Quarter ended 30 Jun 2026
Slides (44 pages)Official transcript (PDF) ↗Press release ↗Investor relations ↗
Summaries and transcripts are machine-generated and can contain errors.
In brief
Coinbase reported Q2 2026 total revenue of $1.2B, a net loss of $(359)M and Adjusted EBITDA of $208M.
Coinbase's second quarter was weak because crypto trading slowed. Total revenue was $1.2B, down 14% from the prior quarter. Transaction revenue fell to $599M as Total Market Crypto Spot Trading Volume dropped 25%. The net loss was $(359)M, and Adjusted EBITDA was $208M, the 14th straight positive quarter. Subscription and services revenue of $555M made up 48% of net revenue. Coinbase also hit a record share of crypto trading volume and cut headcount by 14% in May.
For Q3, management expects subscription and services revenue of $500-$580 million, lower than Q2's $555M at the midpoint. It expects Adjusted Expenses of $980-$1,080 million. It lowered its 2026 Adjusted Expenses range to $4,200-$4,450 million. The main tension is that revenue still depends on crypto prices, volatility and trading volumes, while stablecoin income faces lower interest rates and the roll-off of Q2 performance earn outs. Cost cuts are protecting profitability but cannot offset a prolonged slump.
Slides & documents
Open the slide deck (PDF, 44 pages) ↗


Showing the first 6 of 44 pages.
From Coinbase investor relations
- Earnings Presentation VideoSlide deck ↗
- Earnings Presentation TranscriptCompany's official transcript ↗
- Analyst Call TranscriptCompany's official transcript ↗
- Earnings Call TranscriptCompany's official transcript ↗
- Earnings WebcastWebcast replay ↗
- 10-QDocument ↗
SEC filing
Key numbers
- Total revenue · GAAP
- $1.2B
- Net (loss) income · GAAP
- $(359)M
- Diluted net (loss) income per share · GAAP
- (1.36)
- Operating (loss) income · GAAP
- -$113.5M
- Adjusted EBITDA · non-GAAP
- $208M
-14% Q/Q
(127)% Y/Y
360% Y/Y
(59)% Y/Y
| Segment or metric | Value | Change |
|---|---|---|
| Transaction revenue | $599M | (21)% Q/Q |
| Subscription and services revenue | $555M | (5)% Q/Q |
| Consumer transaction revenue | $452M | -20% Q/Q |
| Institutional transaction revenue | $100M | -26% Q/Q |
| Stablecoin revenue | $292M | |
| Average USDC held in Coinbase products | $20B | new all-time high |
| Prediction markets annualized revenue | $100M+ | >2x Q/Q |
Where each number comes from
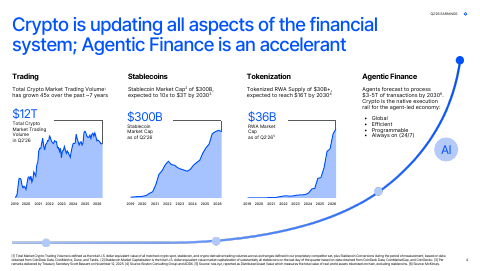
- Total revenue: “$1.2B total revenue (-14% Q/Q) against a backdrop of a decline in Total Market Crypto Trading Volumes1 (-15% Q/Q) and Total Market Crypto Spot Trading Volume2 (-25% Q/Q)”
- Net (loss) income: “Adjusted EBITDA is a non-GAAP financial measure. See Appendix for definition and reconciliation. Net (loss) income $(359)M”
- Diluted net (loss) income per share: “Net income (loss) per share - Diluted 5.14 1.50 (2.49) (1.49) (1.36) (8)% (127)%”
- Operating (loss) income: “Operating (loss) income (24.7) 480.5 273.8 (21.4) (113.5) 430% 360%”
- Adjusted EBITDA: “$208M Adjusted EBITDA in Q2'26, 14th consecutive positive quarter across all market conditions”
- Transaction revenue: “Total revenue $1.2B Transaction revenue $599M Adjusted EBITDA1 $208M Cash & cash equivalents $8.6B Subscription & services revenue $555M”
- Subscription and services revenue: “Total revenue $1.2B Transaction revenue $599M Adjusted EBITDA1 $208M Cash & cash equivalents $8.6B Subscription & services revenue $555M”
- Consumer transaction revenue: “Consumer transaction revenue of $452M (-20% Q/Q) driven by Consumer Crypto Spot Trading Volume decline of (24)%, partially offset by continued growth in prediction markets”
- Institutional transaction revenue: “Institutional transaction revenue of $100M (-26% Q/Q) roughly in line with market declines”
- Stablecoin revenue: “Stablecoin revenue of $292M driven by new ATH in Average USDC Held in Coinbase Products offset by declines in interest rates & off- platform balances”
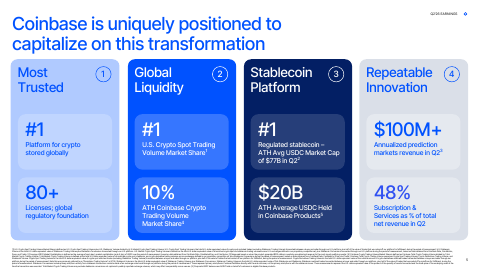
- Average USDC held in Coinbase products: “New ATH of $20B average USDC held in Coinbase products in Q2”
- Prediction markets annualized revenue: “Prediction Markets: $100M+ annualized revenue1 as of Q2ʼ26; >2x revenue and contracts growth Q/Q”
Copied from the press release ↗ and other documents in the SEC filing ↗. A figure is published only if its sentence is in the filing.
| From the filing | Q2 2026 | vs year ago | vs last quarter |
|---|---|---|---|
| Revenue | $1.2B | −18.5% | −13.7% |
| Operating income | -$113.5M | −360.4% | −429.8% |
| Net income | -$359.5M | — | +8.8% |
| Diluted EPS | -$1.36 | — | +8.7% |
| Operating margin | -9.3% | −7.7 pts | −7.8 pts |
Calculated by code from XBRL, not by the model.
Outlook
| Metric | Period | Outlook |
|---|---|---|
| Subscription and services revenue | Q3ʼ26 | $500-$580 million |
| Adjusted Expenses | Q3ʼ26 | $980-$1,080 million |
| Stock-based compensation | Q3ʼ26 | ~$245 million |
| Amortization of intangible assets | Q3'26 | $35 million to $40 million |
| GAAP T&D + G&A + S&M expenses | Q3'26 | $1,015 million to $1,120 million |
| GAAP T&D + G&A + S&M expenses | FY'26 | $4,340 million to $4,600 million |
| Amortization of intangible assets | FY'26 | $140 million to $150 million |
Key takeaways
Crypto trading slump drove the revenue decline
Total revenue was $1.2B (-14% Q/Q) as Total Market Crypto Spot Trading Volume fell 25% Q/Q. Transaction revenue of $599M fell 21% Q/Q, less than the market.
Subscription and services cushioned the downturn
Subscription and services revenue was $555M, or 48% of net revenue. Stablecoin revenue of $292M rose on record Average USDC Held in Coinbase Products of $20B, offset by lower rates.
Record market share despite weaker markets
Coinbase Crypto Trading Volume Market Share reached 10.3% vs. 9.1% in Q1, an all-time high. Crypto Derivatives Trading Volume was flat while the market was down 12%.
Cost cuts kept Adjusted EBITDA positive
Adjusted EBITDA was $208M, the 14th consecutive positive quarter. A 14% headcount reduction in May took employees to 4,321, and 2026 Adjusted Expenses guidance fell to $4,200-$4,450 million.
Prediction markets became a $100M+ line
Prediction markets reached $100M+ annualized revenue, with contracts and revenue up more than 2x Q/Q. Sports led, helped by NBA playoffs and World Cup soccer.
Charts
Fourth quarter worked out from the annual figure.
Data
| Q4 2024 | $2.3B * |
| Q1 2025 | $2.0B |
| Q2 2025 | $1.5B |
| Q3 2025 | $1.9B |
| Q4 2025 | $1.8B * |
| Q1 2026 | $1.4B |
| Q2 2026 | $1.2B |
| Q3 2026 | $1.2B |
Data
| Q1 2025 | $0.24 |
| Q2 2025 | $5.14 |
| Q3 2025 | $1.50 |
| Q1 2026 | -$1.49 |
| Q2 2026 | -$1.36 |
| Q3 2026 | $2.51 |
Fourth-quarter EPS appears once the press release is read; filings report it only for the full year.
Data
| Q4 2024 | 45.5% |
| Q1 2025 | 34.7% |
| Q2 2025 | -1.6% |
| Q3 2025 | 25.7% |
| Q4 2025 | 15.4% |
| Q1 2026 | -1.5% |
| Q2 2026 | -9.3% |
| Q3 2026 | 5.1% |
Questions
What were Coinbase's Q2 2026 headline results?
Total revenue was $1.2B, down 14% from Q1 and 19% from a year ago. Net loss was $(359)M, or $(1.36) per diluted share, and Adjusted EBITDA was $208M.
Why did Coinbase's revenue fall in Q2 2026?
Total Market Crypto Spot Trading Volume fell 25% Q/Q and Total Crypto Market Capitalization fell 11%. Crypto Asset Volatility fell 14% to multi-year lows, which suppressed trading.
What is Coinbase guiding for Q3 2026?
It expects subscription and services revenue of $500-$580 million, Adjusted Expenses of $980-$1,080 million and stock-based compensation of about $245 million. Transaction expenses should be mid-teens as a percentage of net revenue.
How did Coinbase change its full-year 2026 expense outlook?
It lowered and narrowed 2026 Adjusted Expenses guidance to $4,200-$4,450 million from an initial $4,250-$4,600 million. It cited a 14% headcount reduction in May.
How strong is Coinbase's balance sheet and capital return?
Cash and cash equivalents were $8.6B, with $1.6B in crypto and marketable investments. Coinbase has returned $2.0B+ to shareholders through buybacks and has $2.0B of authorization remaining.