
Carnival (CCL) · Internet & Travel
Carnival Q3 FY2026 earnings: summary, key numbers & outlook
Results filed 29 Sep 2026 · Quarter ended 31 Aug 2026
Slides (18 pages)Press release ↗Investor relations ↗
Summaries and transcripts are machine-generated and can contain errors.
In brief
Carnival Corporation outperforms guidance with all-time high net income of $1.9 billion, adjusted net income of $2.0 billion, diluted EPS of $1.40 and adjusted EPS of $1.43 in the third quarter 2026.
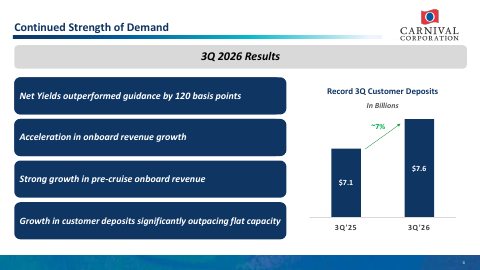
Carnival had a record third quarter. Total revenues were $8,435 million, and net income attributable to the company was $1.9 billion, an all-time high. Net yields, which measure revenue per cruise berth day, rose 2.4 percent in constant currency, more than a point better than June guidance. Adjusted EPS of $1.43 matched last year even though fuel prices and currency rates cost $0.10. Customer deposits reached a third-quarter record of $7.6 billion.
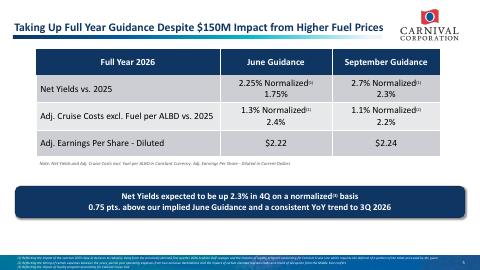
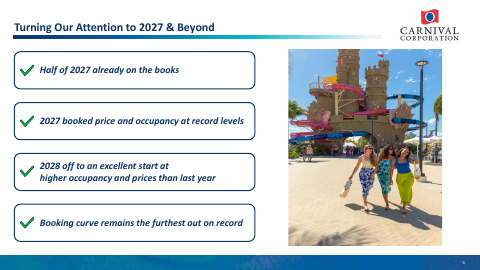
Management raised its full-year 2026 outlook to adjusted EPS of approximately $2.24 and net yields up approximately 2.3 percent in constant currency. Fourth-quarter net yields are expected up approximately 1.7 percent. Booked occupancy and pricing for 2027 are at record levels. The main tension is fuel: the company absorbed a $150 million hit from higher fuel prices, and fuel cost per metric ton is guided to $896 in the fourth quarter, up from $826 in the third.
Slides & documents
Open the slide deck (PDF, 18 pages) ↗
Showing the first 6 of 18 pages.
SEC filing
Key numbers
- Total revenues · GAAP
- $8.4B
- Net income attributable to Carnival Corporation · GAAP
- $1.9 billion
- Diluted EPS · GAAP
- $1.40
- Adjusted diluted EPS · non-GAAP
- $1.43
- Operating income · GAAP
- $2.2B
- Cash from operations · GAAP
- $1.4B
- Adjusted EBITDA · non-GAAP
- $3.0 billion
- Adjusted net income · non-GAAP
- $2.0 billion
vs $8,153 in the prior-year quarter
all-time high
vs $1.33 in the prior-year quarter
in line with prior year
vs 2,271 in the prior-year quarter
vs $1,383 in the prior-year quarter
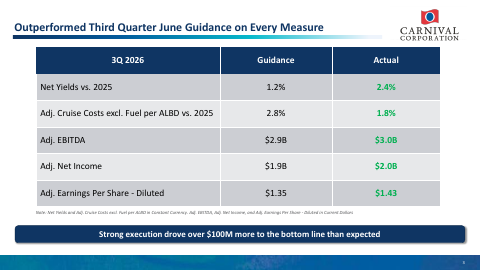
in line with last year and $110 million better than June guidance
| Segment or metric | Value | Change |
|---|---|---|
| Net yields (constant currency) | 2.4 percent | over a point better than June guidance |
| Adjusted cruise costs excluding fuel per ALBD (constant currency) | 1.8 percent | one point better than June guidance |
| Customer deposits | $7.6 billion | surpassing the prior-year record by $0.5 billion |
| Occupancy | 111.8% | vs 111.7% a year ago |
| Fuel consumption per ALBD | 3.8 percent | improved vs prior year |
| Share repurchases year to date | $1.2 billion |
Where each number comes from
- Total revenues: “Total Revenues | $8,435 | $8,153 | $21,263 | $20,292 Less: Cruise and tour operating expenses | (4,628) | (4,385)”
- Net income attributable to Carnival Corporation: “All-time high net income1 of $1.9 billion with adjusted net income2 of $2.0 billion.”
- Diluted EPS: “Diluted EPS of $1.40; adjusted EPS2 of $1.43, in line with prior year despite a $0.10 ($131 million) unfavorable net impact from fuel prices and currency rates.”
- Adjusted diluted EPS: “Diluted EPS of $1.40; adjusted EPS2 of $1.43, in line with prior year despite a $0.10 ($131 million) unfavorable net impact from fuel prices and currency rates.”
- Operating income: “Operating Income | 2,220 | 2,271 | 3,678 | 3,748 Interest income | 17 | 15 | 41 | 34”
- Cash from operations: “Cash from operations | $1,410 | $1,383 | $5,303 | $4,700 Capital expenditures (Purchases of Property and Equipment) | $698 | $648”
- Adjusted EBITDA: “Adjusted EBITDA2 of $3.0 billion, in line with last year’s historic high and $110 million better than June guidance.”
- Adjusted net income: “All-time high net income1 of $1.9 billion with adjusted net income2 of $2.0 billion.”
- Net yields (constant currency): “All-time high net yields (in constant currency) up 2.4 percent, over a point better than June guidance.”
- Adjusted cruise costs excluding fuel per ALBD (constant currency): “Adjusted cruise costs excluding fuel per ALBD2 (in constant currency) increased 1.8 percent, one point better than June guidance.”
- Customer deposits: “reached a third-quarter record of $7.6 billion, surpassing the prior-year record by $0.5 billion despite flat capacity growth”
- Occupancy: “Occupancy percentage (c) | 111.8% | 111.7% | 106.5% | 106.5% Passengers carried (in millions) | 3.9 | 3.8 | 10.5 | 10.3”
- Fuel consumption per ALBD: “Fuel consumption per ALBD improved 3.8 percent compared to prior year, reflecting the company’s efforts and investments to continuously reduce fuel consumption.”
- Share repurchases year to date: “Completed approximately $1.2 billion of share repurchases year to date.”
Copied from the press release ↗ and other documents in the SEC filing ↗. A figure is published only if its sentence is in the filing.
| From the filing | Q3 FY2026 | vs year ago | vs last quarter |
|---|---|---|---|
| Revenue | $8.4B | +3.5% | +26.6% |
| Operating income | $2.2B | −2.2% | +160.9% |
| Net income | $1.9B | +3.7% | +257.5% |
| Diluted EPS | $1.40 | +5.3% | +259.0% |
| Free cash flow | $712.0M | −3.3% | −59.4% |
| Operating margin | 26.3% | −1.6 pts | +13.5 pts |
Calculated by code from XBRL, not by the model.
Outlook
| Metric | Period | Outlook |
|---|---|---|
| Net yields (constant currency) | fourth quarter of 2026 | approximately 1.7 percent |
| Adjusted EPS - diluted | fourth quarter of 2026 | Approx. $0.20 |
| Newbuild capital expenditures | fourth quarter of 2026 | $0.3 billion |
| Non-newbuild capital expenditures | fourth quarter of 2026 | $0.9 billion |
| Net yields (constant currency) | full year 2026 | approximately 2.3 percent |
| Adjusted cruise costs excluding fuel per ALBD (constant currency) | full year 2026 | approximately 2.2 percent |
| Adjusted EPS - diluted | full year 2026 | Approx. $2.24 |
Key takeaways
Record quarter, ahead of June guidance
Net yields rose 2.4 percent in constant currency against guidance of 1.2%, and adjusted EPS was $1.43 against $1.35 guided in June.
Fuel prices offset the operating gains
Fuel and currency rates cost $0.10 ($131 million), so adjusted EPS of $1.43 was in line with prior year. Fuel expense was $615 million against $451 million a year ago.
Full-year adjusted EPS guidance rises to $2.24
Adjusted EPS guidance moved from $2.22 in June to approximately $2.24, with operational improvement of more than $150 million overcoming a $150 million fuel impact.
2027 bookings are at record levels
Booked occupancy and pricing for 2027 are at record levels, and 2028 is off to an excellent start. Customer deposits reached $7.6 billion on flat capacity.
Capital returns up and debt coming down
Carnival repurchased about $1.2 billion of shares year to date and paid $204 million in dividends in the quarter. It also redeemed $500 million of seven percent notes, and debt fell to $23,912 million from $26,640 million at November 30, 2025.
Charts
Fourth quarter worked out from the annual figure.
Data
| Q4 FY24 | $5.9B * |
| Q1 FY25 | $5.8B |
| Q2 FY25 | $6.3B |
| Q3 FY25 | $8.2B |
| Q4 FY25 | $6.3B * |
| Q1 FY26 | $6.2B |
| Q2 FY26 | $6.7B |
| Q3 FY26 | $8.4B |
Data
| Q1 FY25 | -$0.06 |
| Q2 FY25 | $0.42 |
| Q3 FY25 | $1.33 |
| Q1 FY26 | $0.19 |
| Q2 FY26 | $0.39 |
| Q3 FY26 | $1.40 |
Fourth-quarter EPS appears once the press release is read; filings report it only for the full year.
Data
| Q4 FY24 | 9.4% |
| Q1 FY25 | 9.3% |
| Q2 FY25 | 14.8% |
| Q3 FY25 | 27.9% |
| Q4 FY25 | 11.6% |
| Q1 FY26 | 9.8% |
| Q2 FY26 | 12.8% |
| Q3 FY26 | 26.3% |
Data
| Q4 FY24 | $319.0M |
| Q1 FY25 | $318.0M |
| Q2 FY25 | $1.5B |
| Q3 FY25 | $736.0M |
| Q4 FY25 | $12.0M |
| Q1 FY26 | $697.0M |
| Q2 FY26 | $1.8B |
| Q3 FY26 | $712.0M |
Operating cash flow minus capital expenditure, from cash flow statements.
Questions
What were Carnival's third-quarter 2026 results?
Total revenues were $8,435 million and net income attributable to Carnival was $1.9 billion, both all-time highs. Diluted EPS was $1.40 and adjusted EPS was $1.43.
How did the quarter compare with Carnival's own guidance?
Net yields rose 2.4 percent against 1.2% guided in June. Adjusted EBITDA was $3.0 billion against $2.9B guided, and adjusted EPS was $1.43 against $1.35.
What is Carnival's outlook for full-year 2026?
Carnival expects adjusted EPS of approximately $2.24, up from $2.22 in June guidance. It also expects net yields up approximately 2.3 percent in constant currency and adjusted net income of approximately $3,080 million.
What is the biggest risk Carnival highlighted?
Fuel is the main cost risk: higher fuel prices cost $150 million versus June guidance, and fuel cost per metric ton is guided at $896 in the fourth quarter. A 10% change in fuel cost per metric ton is worth $59 million of fourth-quarter adjusted net income.
How is demand looking for 2027?
Booked occupancy and pricing for 2027 are at record levels, and about half of 2027 is already on the books. Third-quarter customer deposits were a record $7.6 billion, up $0.5 billion from the prior-year record on flat capacity.
Call recording
Call recording on YouTube ↗. Official replay ↗.