
Amazon (AMZN) · Internet & Retail
Amazon Q2 2026 earnings: summary, key numbers & outlook
Results filed 30 Jul 2026 · Quarter ended 30 Jun 2026
Slides (15 pages)Press release ↗Investor relations ↗
Summaries and transcripts are machine-generated and can contain errors.
In brief
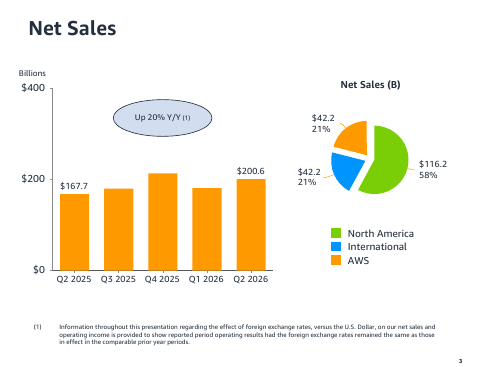
Net sales increased 20% to $200.6 billion in the second quarter, with operating income of $27.5 billion, up 43% year-over-year, and AWS net sales up 37%.
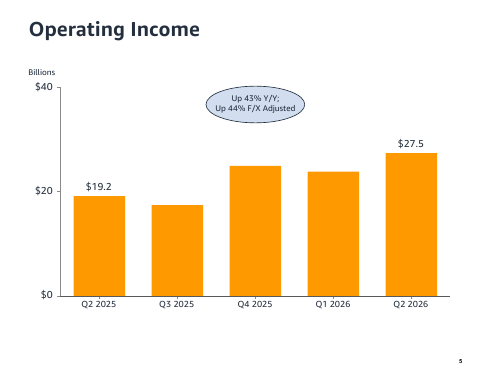
Amazon's second quarter sales rose 20% to $200.6 billion, and operating income rose to $27.5 billion from $19.2 billion a year earlier. AWS, the cloud unit, grew 37%, its fastest pace in 18 quarters, and earned $16.6 billion of operating income. Net income was $62.6 billion, or $5.75 per diluted share, boosted by $53.4 billion of non-operating other income, primarily from its Anthropic investments.
For the third quarter, Amazon expects net sales of $197.0 billion to $202.0 billion, 9% to 12% growth, and operating income of $22.5 billion to $26.5 billion. The main tension is spending: trailing twelve-month purchases of property and equipment rose by $66.1 billion for AI, pushing free cash flow to an outflow of $7.6 billion even as operating cash flow grew 33%.
Slides & documents
Open the slide deck (PDF, 15 pages) ↗

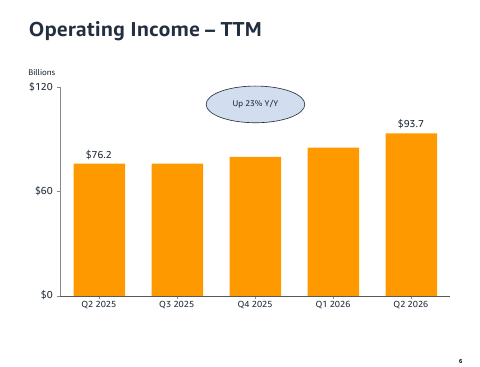
Showing the first 6 of 15 pages.
From Amazon investor relations
SEC filing
Key numbers
- Net sales · GAAP
- $200.6 billion
- Operating income · GAAP
- $27.5 billion
- Net income · GAAP
- $62.6 billion
- Diluted earnings per share · GAAP
- $5.75
- Operating margin, % of net sales · GAAP
- 13.7%
- Operating cash flow, trailing twelve months · GAAP
- $161.4 billion
- Free cash flow, trailing twelve months (outflow) · non-GAAP
- $7.6 billion
up 20% from a year ago
up 43% from a year ago
compared with $18.2 billion a year ago
compared with $1.68 a year ago
compared with 11.4% in Q2 2025
up 33% from a year ago
compared with an inflow of $18.2 billion a year ago
| Segment or metric | Value | Change |
|---|---|---|
| AWS net sales | $42.2 billion | up 37% year-over-year |
| AWS operating income | $16.6 billion | compared with $10.2 billion in second quarter 2025 |
| North America net sales | $116.2 billion | up 16% year-over-year |
| International net sales | $42.2 billion | up 15% year-over-year |
| Advertising services net sales | $19,809 | up 26% |
| Third-party seller services net sales | $46,780 | up 16% |
Where each number comes from
- Net sales: “Net sales increased 20% to $200.6 billion in the second quarter, compared with $167.7 billion in second quarter 2025.”
- Operating income: “Operating income increased to $27.5 billion in the second quarter, compared with $19.2 billion in second quarter 2025.”
- Net income: “Net income increased to $62.6 billion in the second quarter, or $5.75 per diluted share, compared with $18.2 billion, or $1.68 per diluted share, in second quarter 2025.”
- Diluted earnings per share: “Net income increased to $62.6 billion in the second quarter, or $5.75 per diluted share, compared with $18.2 billion, or $1.68 per diluted share, in second quarter 2025.”
- Operating margin, % of net sales: “Operating margin -- % of WW net sales | 11.8% | 11.4% | 9.7% | 11.7% | 13.1% | 13.7% | N/A”
- Operating cash flow, trailing twelve months: “Operating cash flow increased 33% to $161.4 billion for the trailing twelve months, compared with $121.1 billion for the trailing twelve months ended June 30, 2025.”
- Free cash flow, trailing twelve months (outflow): “Free cash flow decreased to an outflow of $7.6 billion for the trailing twelve months, driven primarily by a year-over-year increase of $66.1 billion”
- AWS net sales: “AWS segment sales increased 37% year-over-year to $42.2 billion.”
- AWS operating income: “AWS segment operating income was $16.6 billion, compared with $10.2 billion in second quarter 2025.”
- North America net sales: “North America segment sales increased 16% year-over-year to $116.2 billion.”
- International net sales: “International segment sales increased 15% year-over-year to $42.2 billion.”
- Advertising services net sales: “Advertising services (4) | $13,921 | $15,694 | $17,703 | $21,317 | $17,243 | $19,809 | 26%”
- Third-party seller services net sales: “Third-party seller services (3) | $36,512 | $40,348 | $42,486 | $52,816 | $41,578 | $46,780 | 16%”
Copied from the press release ↗ and other documents in the SEC filing ↗. A figure is published only if its sentence is in the filing.
| From the filing | Q2 2026 | vs year ago | vs last quarter |
|---|---|---|---|
| Revenue | $200.6B | +19.6% | +10.5% |
| Operating income | $27.5B | +43.2% | +15.1% |
| Net income | $62.6B | +244.9% | +107.1% |
| Diluted EPS | $5.75 | +242.3% | +106.8% |
| Free cash flow | -$8.8B | — | +51.5% |
| Operating margin | 13.7% | +2.3 pts | +0.6 pts |
Calculated by code from XBRL, not by the model.
Outlook
| Metric | Period | Outlook |
|---|---|---|
| Net sales | third quarter 2026 | between $197.0 billion and $202.0 billion |
| Operating income | third quarter 2026 | between $22.5 billion and $26.5 billion |
Key takeaways
AWS growth accelerated to fastest in 18 quarters
AWS net sales increased 37% year-over-year to $42.2 billion, with operating income of $16.6 billion versus $10.2 billion a year earlier.
Net income inflated by Anthropic investment gains
Net income was $62.6 billion, including non-operating pre-tax other income of $53.4 billion, primarily from investments in Anthropic. Operating income was $27.5 billion.
AI spending pushed free cash flow negative
Trailing twelve-month free cash flow was an outflow of $7.6 billion, versus an inflow of $18.2 billion a year earlier, as purchases of property and equipment rose $66.1 billion.
Advertising and marketplace sales accelerated
Advertising services grew 26% and third-party seller services grew 16%, while online stores grew 15%.
Third-quarter guidance implies slower sales growth
Amazon guided net sales to $197.0 billion to $202.0 billion, 9% to 12% growth, and operating income to $22.5 billion to $26.5 billion. Excluding Prime Day timing, growth would be nearly 400 basis points higher.
Charts
Fourth quarter worked out from the annual figure.
Data
| Q4 2024 | $187.8B * |
| Q1 2025 | $155.7B |
| Q2 2025 | $167.7B |
| Q3 2025 | $180.2B |
| Q4 2025 | $213.4B * |
| Q1 2026 | $181.5B |
| Q2 2026 | $200.6B |
| Q3 2026 | $201.9B |
Data
| Q1 2025 | $1.59 |
| Q2 2025 | $1.68 |
| Q3 2025 | $1.95 |
| Q1 2026 | $2.78 |
| Q2 2026 | $5.75 |
| Q3 2026 | $1.89 |
Fourth-quarter EPS appears once the press release is read; filings report it only for the full year.
Data
| Q4 2024 | 11.3% |
| Q1 2025 | 11.8% |
| Q2 2025 | 11.4% |
| Q3 2025 | 9.7% |
| Q4 2025 | 11.7% |
| Q1 2026 | 13.1% |
| Q2 2026 | 13.7% |
| Q3 2026 | 13.9% |
Data
| Q4 2024 | $17.8B |
| Q1 2025 | -$8.0B |
| Q2 2025 | $332.0M |
| Q3 2025 | $430.0M |
| Q4 2025 | $14.9B |
| Q1 2026 | -$18.2B |
| Q2 2026 | -$8.8B |
| Q3 2026 | -$34.8B |
Operating cash flow minus capital expenditure, from cash flow statements.
Questions
How did Amazon perform in Q2 2026?
Net sales rose 20% to $200.6 billion and operating income rose to $27.5 billion from $19.2 billion. Net income was $62.6 billion, or $5.75 per diluted share.
How fast did AWS grow in Q2 2026?
AWS net sales increased 37% to $42.2 billion, its fastest growth in 18 quarters. AWS operating income was $16.6 billion, a 39.4% margin.
Why was net income so much higher than operating income?
Net income included non-operating pre-tax other income of $53.4 billion, primarily from Amazon's investments in Anthropic. Operating income was $27.5 billion.
What is Amazon's Q3 2026 guidance?
Amazon expects net sales of $197.0 billion to $202.0 billion, or 9% to 12% growth, and operating income of $22.5 billion to $26.5 billion, compared with $17.4 billion in Q3 2025. The guidance assumes an unfavorable foreign exchange impact of about 80 basis points.