
AMD (AMD) · Semiconductors
AMD Q2 2026 earnings: summary, key numbers & outlook
Results filed 4 Aug 2026 · Quarter ended 27 Jun 2026
Slides (27 pages)Press release ↗Investor relations ↗
Summaries and transcripts are machine-generated and can contain errors.
In brief
AMD reported second quarter revenue of $11.5 billion, up 50% year-over-year, with diluted earnings per share of $1.38 and non-GAAP diluted earnings per share of $1.66.
AMD posted record second-quarter revenue of $11.5 billion, up 50% from a year ago. Data Center revenue was $6.7 billion, up 107%, and made up 58% of the total. GAAP gross margin was 54% and non-GAAP gross margin was 56%. GAAP operating income was $2.0 billion, against a loss a year ago. Client revenue grew, Embedded grew, and Gaming fell 31%.
For the third quarter, AMD expects revenue of approximately $13 billion, plus or minus $300 million, and non-GAAP gross margin of approximately 56%. Management expects Data Center sales to accelerate in the second half as Helios racks begin to ramp. The main tension is execution. Capital spending rose to $808 million and receivables grew, while free cash flow fell from the prior quarter. Export controls and memory supply are named risks.
Slides & documents
Open the slide deck (PDF, 27 pages) ↗
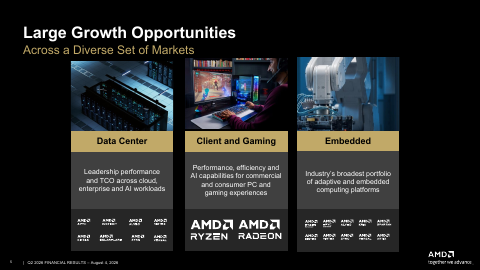
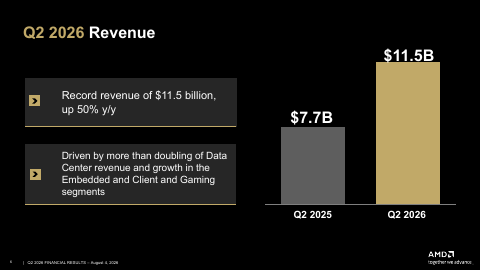
Showing the first 6 of 27 pages.
From AMD investor relations
SEC filing
Key numbers
- Revenue · GAAP
- $11.5 billion
- Gross margin · GAAP
- 54%
- Operating income · GAAP
- $2.0 billion
- Operating margin · GAAP
- 17%
- Net income · GAAP
- $2.3 billion
- Diluted EPS · GAAP
- $1.38
- Non-GAAP diluted EPS · non-GAAP
- $1.66
- Operating cash flow (continuing operations) · GAAP
- $2.4B
up 50% from a year ago
up 14 ppts from a year ago
up 19 ppts from a year ago
up 163% from a year ago
up 156% from a year ago
up 246% from a year ago
| Segment or metric | Value | Change |
|---|---|---|
| Data Center revenue | $6.7 billion | up 107% year-over-year |
| Client and Gaming revenue | $3.8 billion | up 6% year-over-year |
| Client revenue | $3.1 billion | up 23% year-over-year |
| Gaming revenue | $779 million | down 31% year-over-year |
| Embedded revenue | $977 million | up 19% year-over-year |
Where each number comes from
- Revenue: “Second quarter revenue was $11.5 billion, gross margin was 54%, operating income was $2.0 billion, net income was $2.3 billion and diluted earnings per share was $1.38.”
- Gross margin: “Second quarter revenue was $11.5 billion, gross margin was 54%, operating income was $2.0 billion, net income was $2.3 billion and diluted earnings per share was $1.38.”
- Operating income: “Second quarter revenue was $11.5 billion, gross margin was 54%, operating income was $2.0 billion, net income was $2.3 billion and diluted earnings per share was $1.38.”
- Operating margin: “Operating margin | 17% | (2)% | Up 19 ppts | 14% | Up 3 ppts”
- Net income: “Second quarter revenue was $11.5 billion, gross margin was 54%, operating income was $2.0 billion, net income was $2.3 billion and diluted earnings per share was $1.38.”
- Diluted EPS: “Second quarter revenue was $11.5 billion, gross margin was 54%, operating income was $2.0 billion, net income was $2.3 billion and diluted earnings per share was $1.38.”
- Non-GAAP diluted EPS: “On a non-GAAP(*) basis, gross margin was 56%, operating income was $3.1 billion, net income was $2.8 billion and diluted earnings per share was $1.66.”
- Operating cash flow (continuing operations): “GAAP net cash provided by operating activities of continuing operations | $2,366 | $2,955 | $1,462 | $5,321 | $2,401”
- Data Center revenue: “Data Center segment revenue was $6.7 billion, up 107% year-over-year, driven by strong demand for AMD EPYC™ processors and AMD Instinct™ GPUs.”
- Client and Gaming revenue: “Client and Gaming segment revenue was $3.8 billion, up 6% year-over-year.”
- Client revenue: “Client business revenue was $3.1 billion, up 23% year-over-year, primarily driven by strong demand for AMD Ryzen™ processors.”
- Gaming revenue: “Gaming business revenue was $779 million, down 31% year-over-year, due to lower semi-custom revenue.”
- Embedded revenue: “Embedded segment revenue was $977 million, up 19% year-over-year, as demand strengthened across multiple end markets.”
Copied from the press release ↗ and other documents in the SEC filing ↗. A figure is published only if its sentence is in the filing.
| From the filing | Q2 2026 | vs year ago | vs last quarter |
|---|---|---|---|
| Revenue | $11.5B | +50.1% | +12.5% |
| Operating income | $2.0B | — | +34.8% |
| Net income | $2.3B | +163.4% | +66.1% |
| Diluted EPS | $1.38 | +155.6% | +64.3% |
| Free cash flow | $1.6B | −9.9% | −39.3% |
| Gross margin | 53.8% | +14.0 pts | +1.0 pts |
| Operating margin | 17.3% | +19.0 pts | +2.9 pts |
Calculated by code from XBRL, not by the model.
Outlook
| Metric | Period | Outlook |
|---|---|---|
| Revenue | third quarter of 2026 | $13 billion |
| Non-GAAP gross margin | third quarter of 2026 | approximately 56% |
| Non-GAAP operating expenses | Q3'26 | ~$3.65 Billion |
| Other income (expense) net of interest expense | Q3'26 | ~$55 Million |
| Effective tax rate | Q3'26 | 13% of pre-tax income |
| Diluted share count | Q3'26 | ~1.66 Billion shares |
Key takeaways
Data Center more than doubled and now leads
Data Center revenue was $6.7 billion, up 107% year-over-year, and represented 58% of company revenue. Segment operating income was $2,103 million versus a $(155) million loss a year ago.
Margins expanded sharply on mix
GAAP gross margin was 54% versus 40% a year ago, and non-GAAP gross margin was 56%. Non-GAAP operating margin reached 27%, up 15 ppts.
Third-quarter outlook implies further acceleration
AMD expects revenue of approximately $13 billion, plus or minus $300 million, and non-GAAP gross margin of approximately 56%. The mid-point represents year-over-year growth of approximately 41%.
Cash conversion lagged earnings this quarter
Free cash flow was $1,558 million versus $2,566 million in Q1'26, as capital expenditures rose to $808 million. Accounts receivable rose to $7,281 million.
Helios and Anthropic deal anchor AI growth
AMD announced a partnership with Anthropic to deploy up to 2 gigawatts of MI450 Series GPUs in Helios racks. Microsoft is also expanding Helios deployments on Azure.
Charts
Fourth quarter worked out from the annual figure.
Data
| Q4 2024 | $7.7B * |
| Q1 2025 | $7.4B |
| Q2 2025 | $7.7B |
| Q3 2025 | $9.2B |
| Q4 2025 | $10.3B * |
| Q1 2026 | $10.3B |
| Q2 2026 | $11.5B |
| Q3 2026 | $13.4B |
Data
| Q1 2025 | $0.44 |
| Q2 2025 | $0.54 |
| Q3 2025 | $0.75 |
| Q1 2026 | $0.84 |
| Q2 2026 | $1.38 |
| Q3 2026 | $1.46 |
Fourth-quarter EPS appears once the press release is read; filings report it only for the full year.
Data
| Q4 2024 | 11.4% |
| Q1 2025 | 10.8% |
| Q2 2025 | -1.7% |
| Q3 2025 | 13.7% |
| Q4 2025 | 17.1% |
| Q1 2026 | 14.4% |
| Q2 2026 | 17.3% |
| Q3 2026 | 21.2% |
Data
| Q4 2024 | $1.1B |
| Q1 2025 | $727.0M |
| Q2 2025 | $1.7B |
| Q3 2025 | $1.9B |
| Q4 2025 | $2.4B |
| Q1 2026 | $2.6B |
| Q2 2026 | $1.6B |
| Q3 2026 | $554.0M |
Operating cash flow minus capital expenditure, from cash flow statements.
Questions
What were AMD's Q2 2026 results?
Revenue was $11.5 billion, up 50% year-over-year, with GAAP diluted EPS of $1.38 and non-GAAP diluted EPS of $1.66. GAAP gross margin was 54% and non-GAAP gross margin was 56%.
How big is AMD's Data Center business now?
Data Center segment revenue was $6.7 billion, up 107% year-over-year, and represented 58% of company revenue. Its operating income was $2,103 million.
What is AMD's guidance for the third quarter of 2026?
AMD expects revenue of approximately $13 billion, plus or minus $300 million, and non-GAAP gross margin of approximately 56%. It also guided non-GAAP operating expenses of about $3.65 billion and a 13% tax rate.
How did Client, Gaming and Embedded perform?
Client revenue was $3.1 billion, up 23%, and Gaming revenue was $779 million, down 31% on lower semi-custom revenue. Embedded revenue was $977 million, up 19%.
How was AMD's cash flow and balance sheet?
Operating cash flow from continuing operations was $2,366 million and free cash flow was $1,558 million. Cash, cash equivalents and short-term investments were a record $13,111 million against total debt of $3,226 million.